Multi-Venue Perpetual Futures.
AI-Powered. Built Different.
What if Blizzard made a crypto trading terminal?
Local AI strategy engine. Drift + Hyperliquid execution. 25+ markets. 1x leverage only. Your keys never leave your machine.
Welcome to The Trenches
2,770+
Battle-Tested Fixes
25+
Markets Across 2 Venues
500ms
Position Monitoring
100%
Non-Custodial


Powered By
Introducing Overlord Terminal
-
What is Overlord Terminal?
A professional-grade desktop crypto trading terminal for Windows and Mac. Trade 25+ perpetual futures markets across Drift Protocol and Hyperliquid with a local AI strategy engine that generates autonomous LONG/SHORT signals. 1x leverage only, USDC-margined, 100% non-custodial.
-
Why Build This?
Because 90% of leveraged retail traders lose money. Centralized exchanges carry counterparty risk. And no desktop terminal combines local AI with multi-venue on-chain perp execution. We're applying 20 years of enterprise infrastructure (Morgan Stanley, Lockheed Martin, Jagex) to enforce the discipline that separates survivors from statistics.
-
What Makes It Different?
TARiver — our hybrid AI — combines an instant rule engine with Ollama (qwen2.5:14b) to score 9 weighted indicators into a -15 to +15 confluence score. It trades 25+ markets across Drift and Hyperliquid, detects market regimes, adapts stop losses to volatility, and fires signals in under a second. Two battle-tested archetypes: FUTURE SNIPER (Drift majors) and CHAIN HOPPER (Hyperliquid alt L1s). Everything runs locally. Your keys never leave your machine.
-
Who Built This?
A 20-year senior infrastructure engineer who's built systems for Morgan Stanley, Lockheed Martin, and spent 4 years at Jagex creating backend systems for live service community games. Started in the Solana memecoin trenches. 2,770+ bugs found and fixed. Now pointing that battle-tested infrastructure at multi-venue perpetual futures across Drift and Hyperliquid.


The Problem & Our Solution
 The Problem
-
 Leverage Kills
90% of leveraged retail traders lose money. Exchanges encourage 125x for fees.
Leverage Kills
90% of leveraged retail traders lose money. Exchanges encourage 125x for fees.
-
Counterparty Risk
Centralized exchanges hold your funds. One collapse (FTX) = everything gone.
-
No Edge
Retail trades on gut feeling against algorithmic market makers. Emotion wins every time.
-
No Multi-Venue Terminal
No application combines local AI strategy with multi-venue on-chain perpetual futures execution.
 Our Solution
-
1x Leverage — Non-Negotiable
Hardcoded, validated before every trade. Survival first. No exceptions.
-
Non-Custodial via Drift + Hyperliquid
On-chain perps across two venues. Pyth oracles. Your keys never leave your machine.
-
Local AI Strategy Engine
Ollama (qwen2.5:14b) runs on YOUR machine. Free, private, no API costs, 24/7.
-
Multi-Venue Trading Terminal
25+ markets across Drift and Hyperliquid. Charts, TA indicators, AI signals, positions — one screen.
Core Features
-

TARiver AI Engine
Hybrid rule engine + Ollama AI. 9 weighted indicators. Confluence scoring -15 to +15.
-

Paper Trading
FORWARD test AI strategies on live market data before risking real capital
-

Multi-Venue Execution
Drift Protocol + Hyperliquid. 25+ markets from majors to alt L1s. Non-custodial.
-
GOTCHAs Solved
0 + -
TA Indicators Analyzed
0
Position Monitoring Every 500ms


See It In Action
The PerpTradingView unified terminal — 25+ markets across Drift and Hyperliquid with AI confluence scoring, inline positions, and signal feed. Everything on one screen.
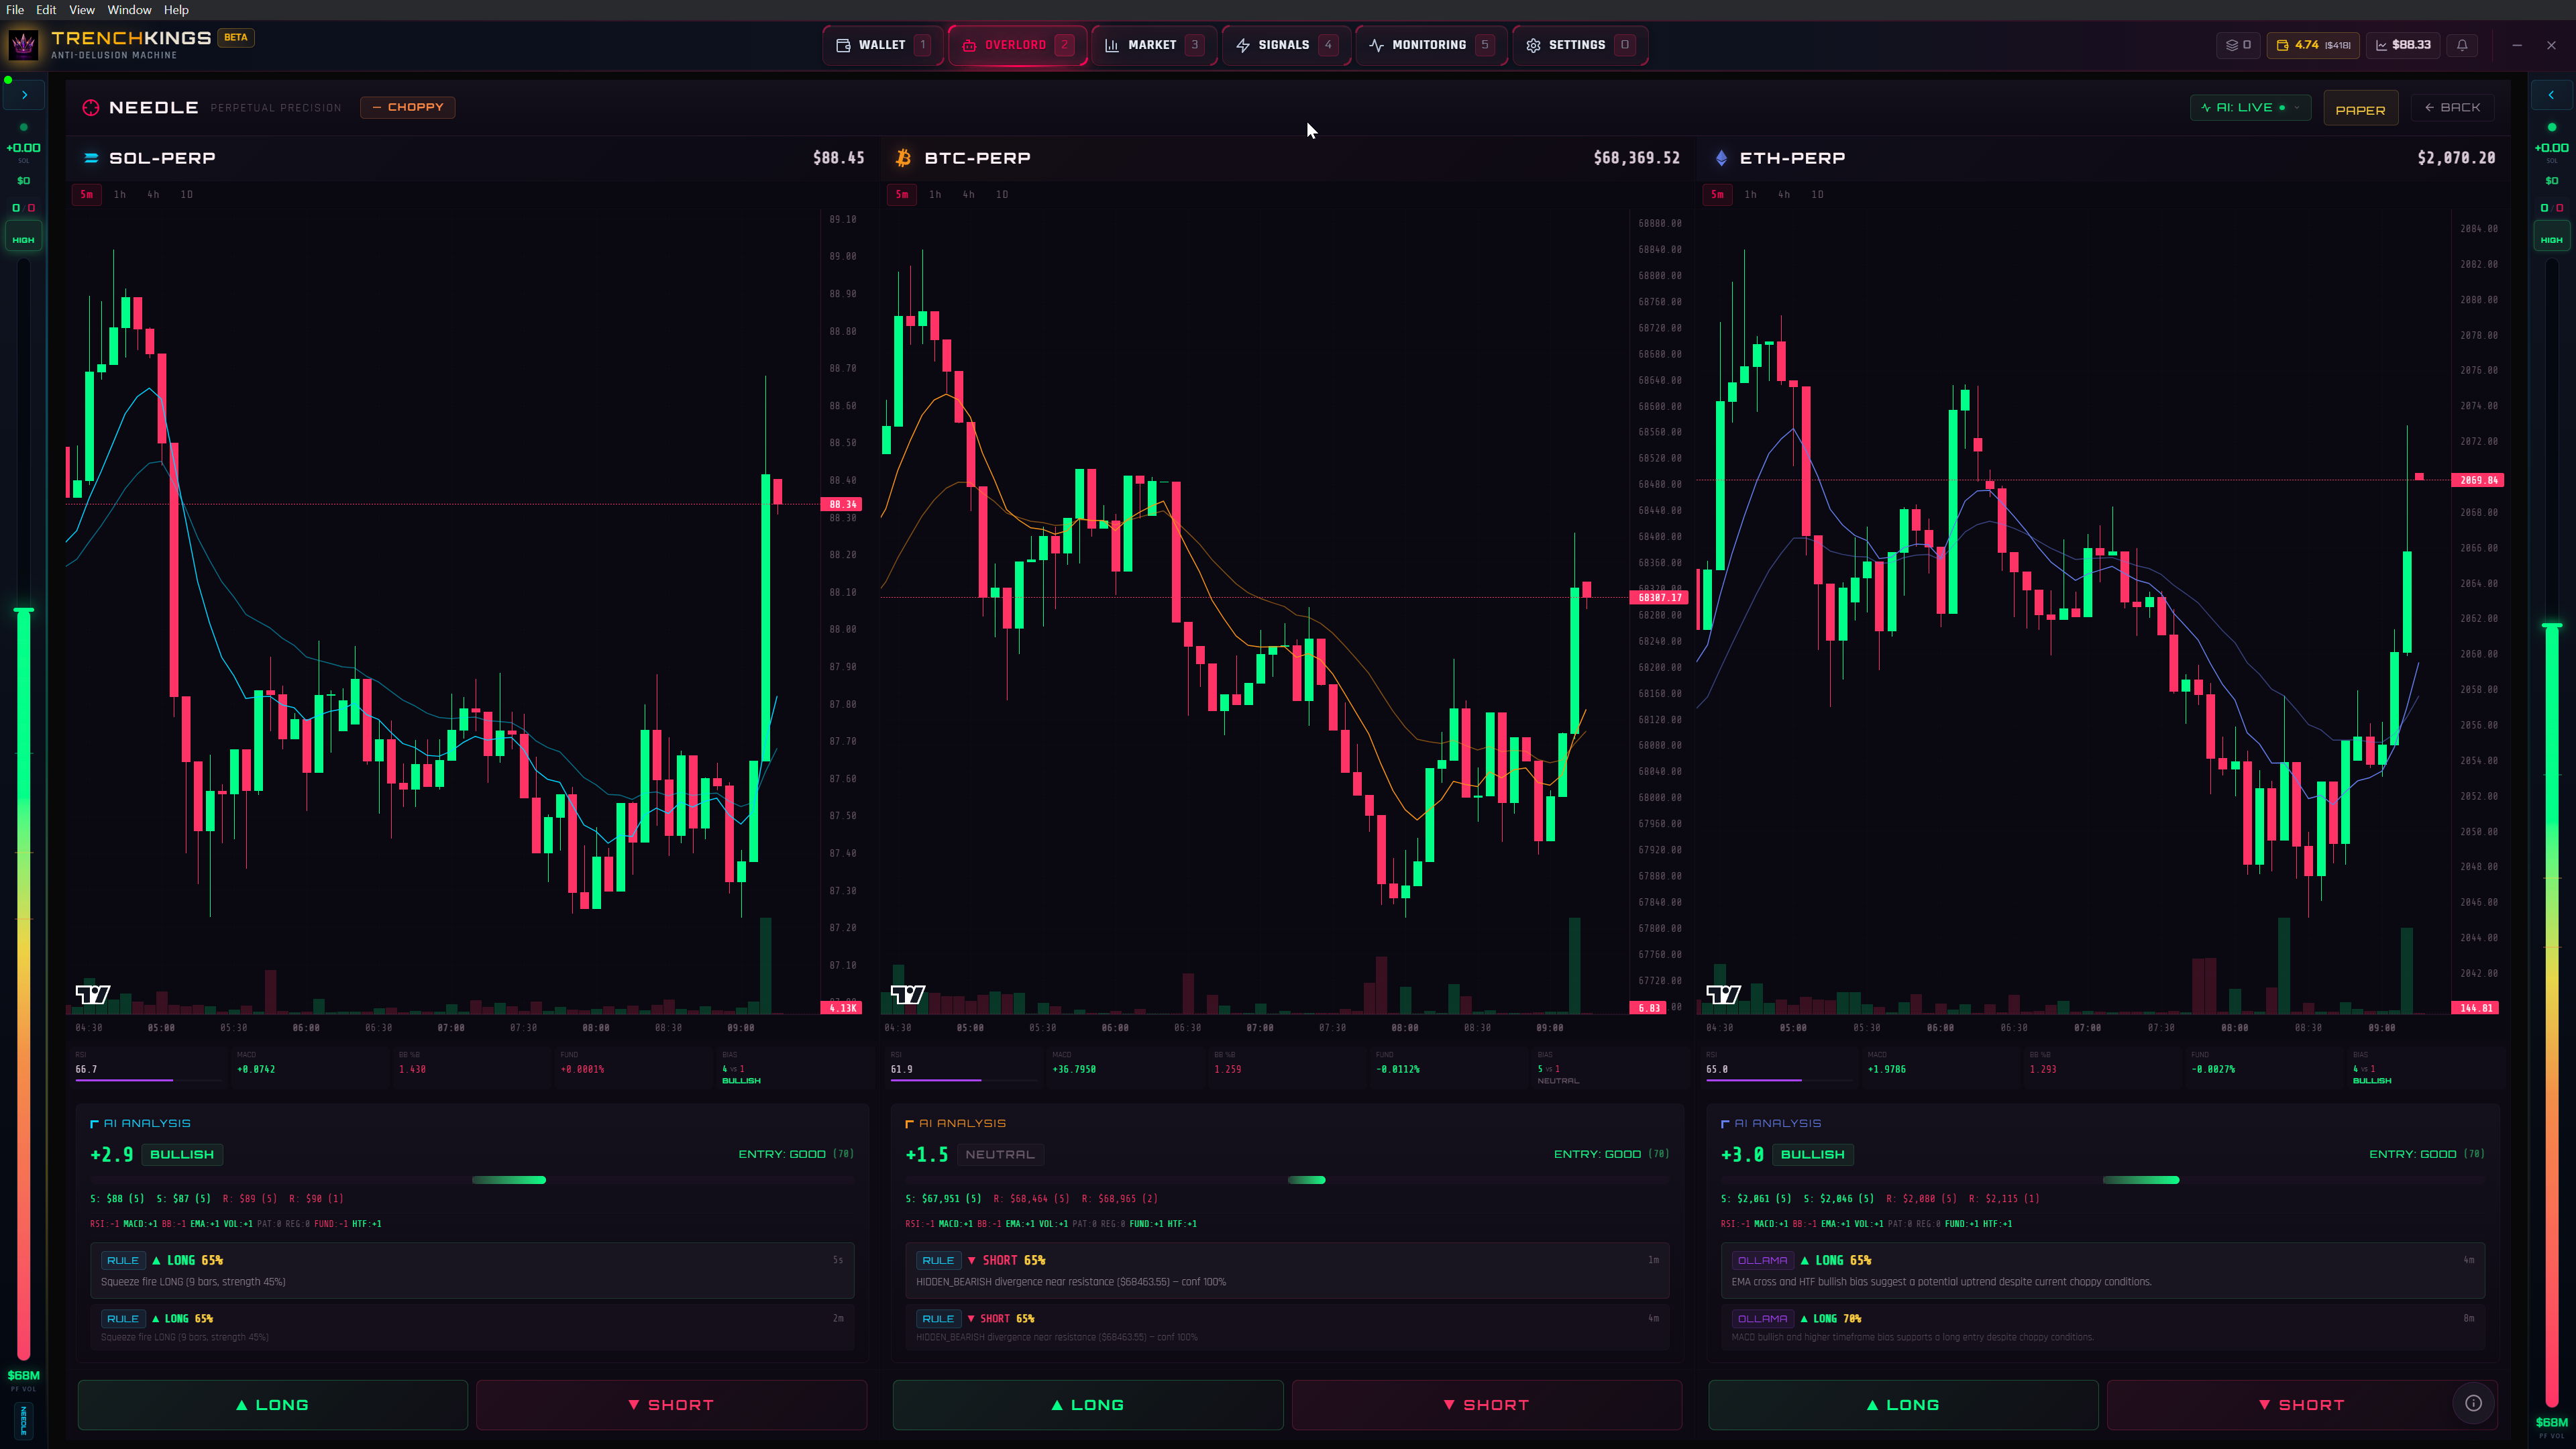
PerpTradingView — Multi-venue trading across Drift and Hyperliquid. Confluence scores, entry grades, AI signals, LONG/SHORT buttons. CHOPPY regime detected.
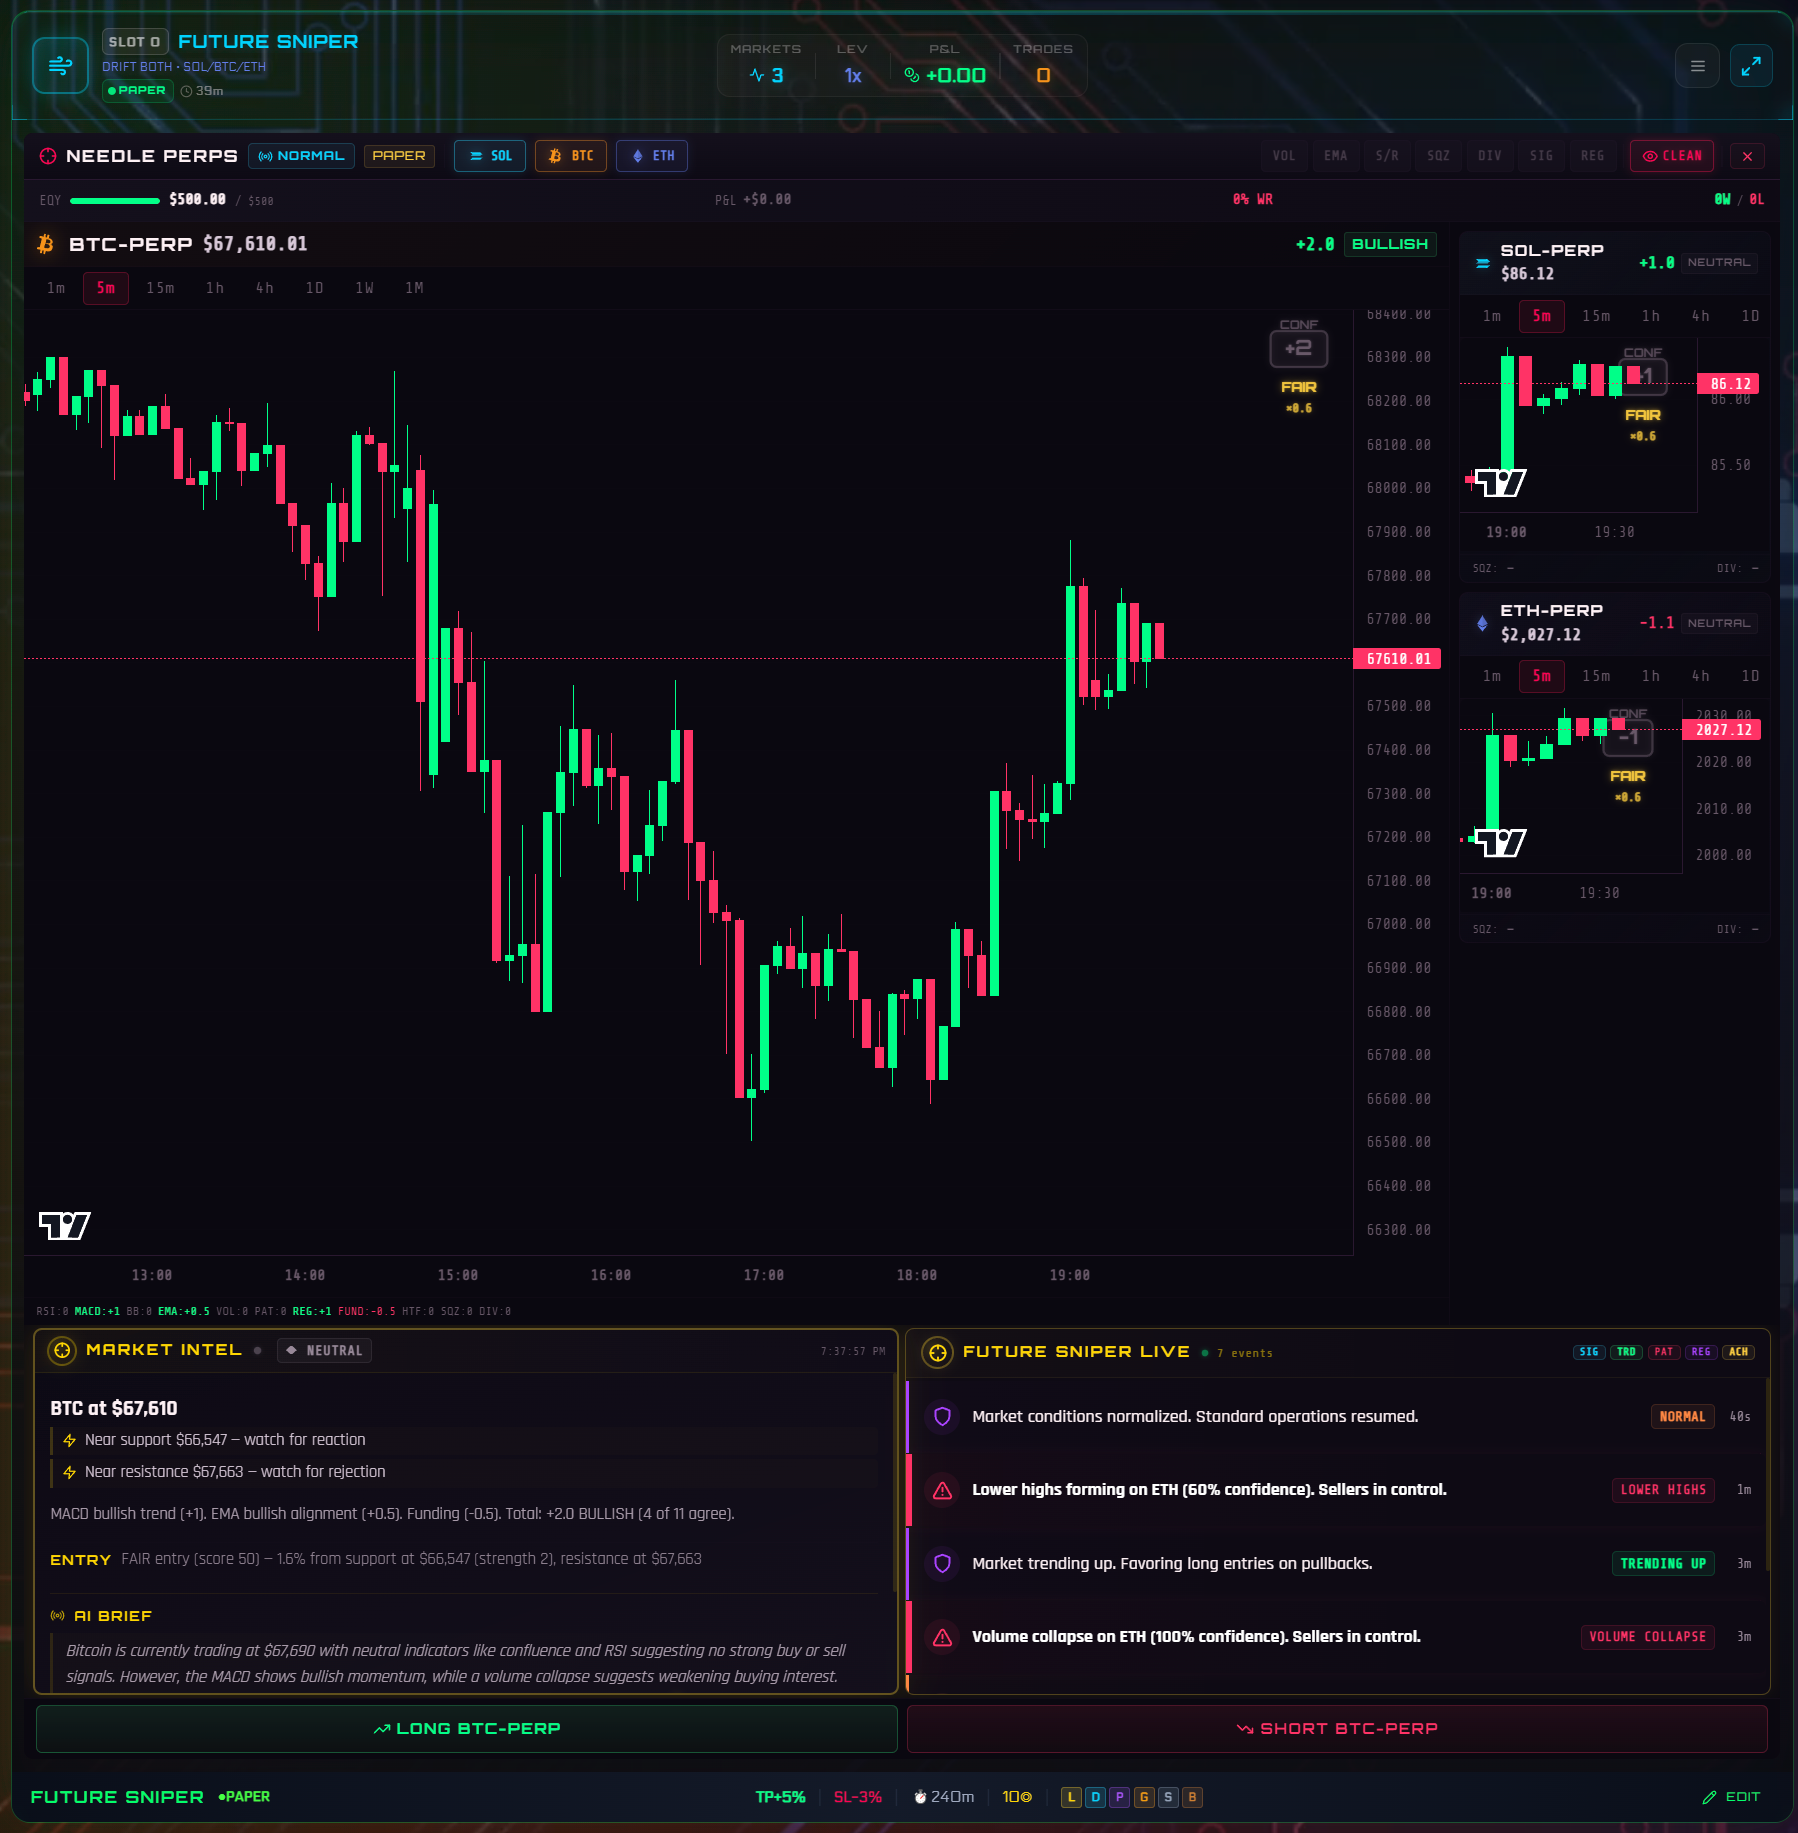
Focused Market View
BTC-PERP full chart with SOL/ETH minis. Market Intel panel, AI Brief, and FUTURE SNIPER LIVE signal feed with regime badges (NORMAL, TRENDING_UP, LOWER_HIGHS).
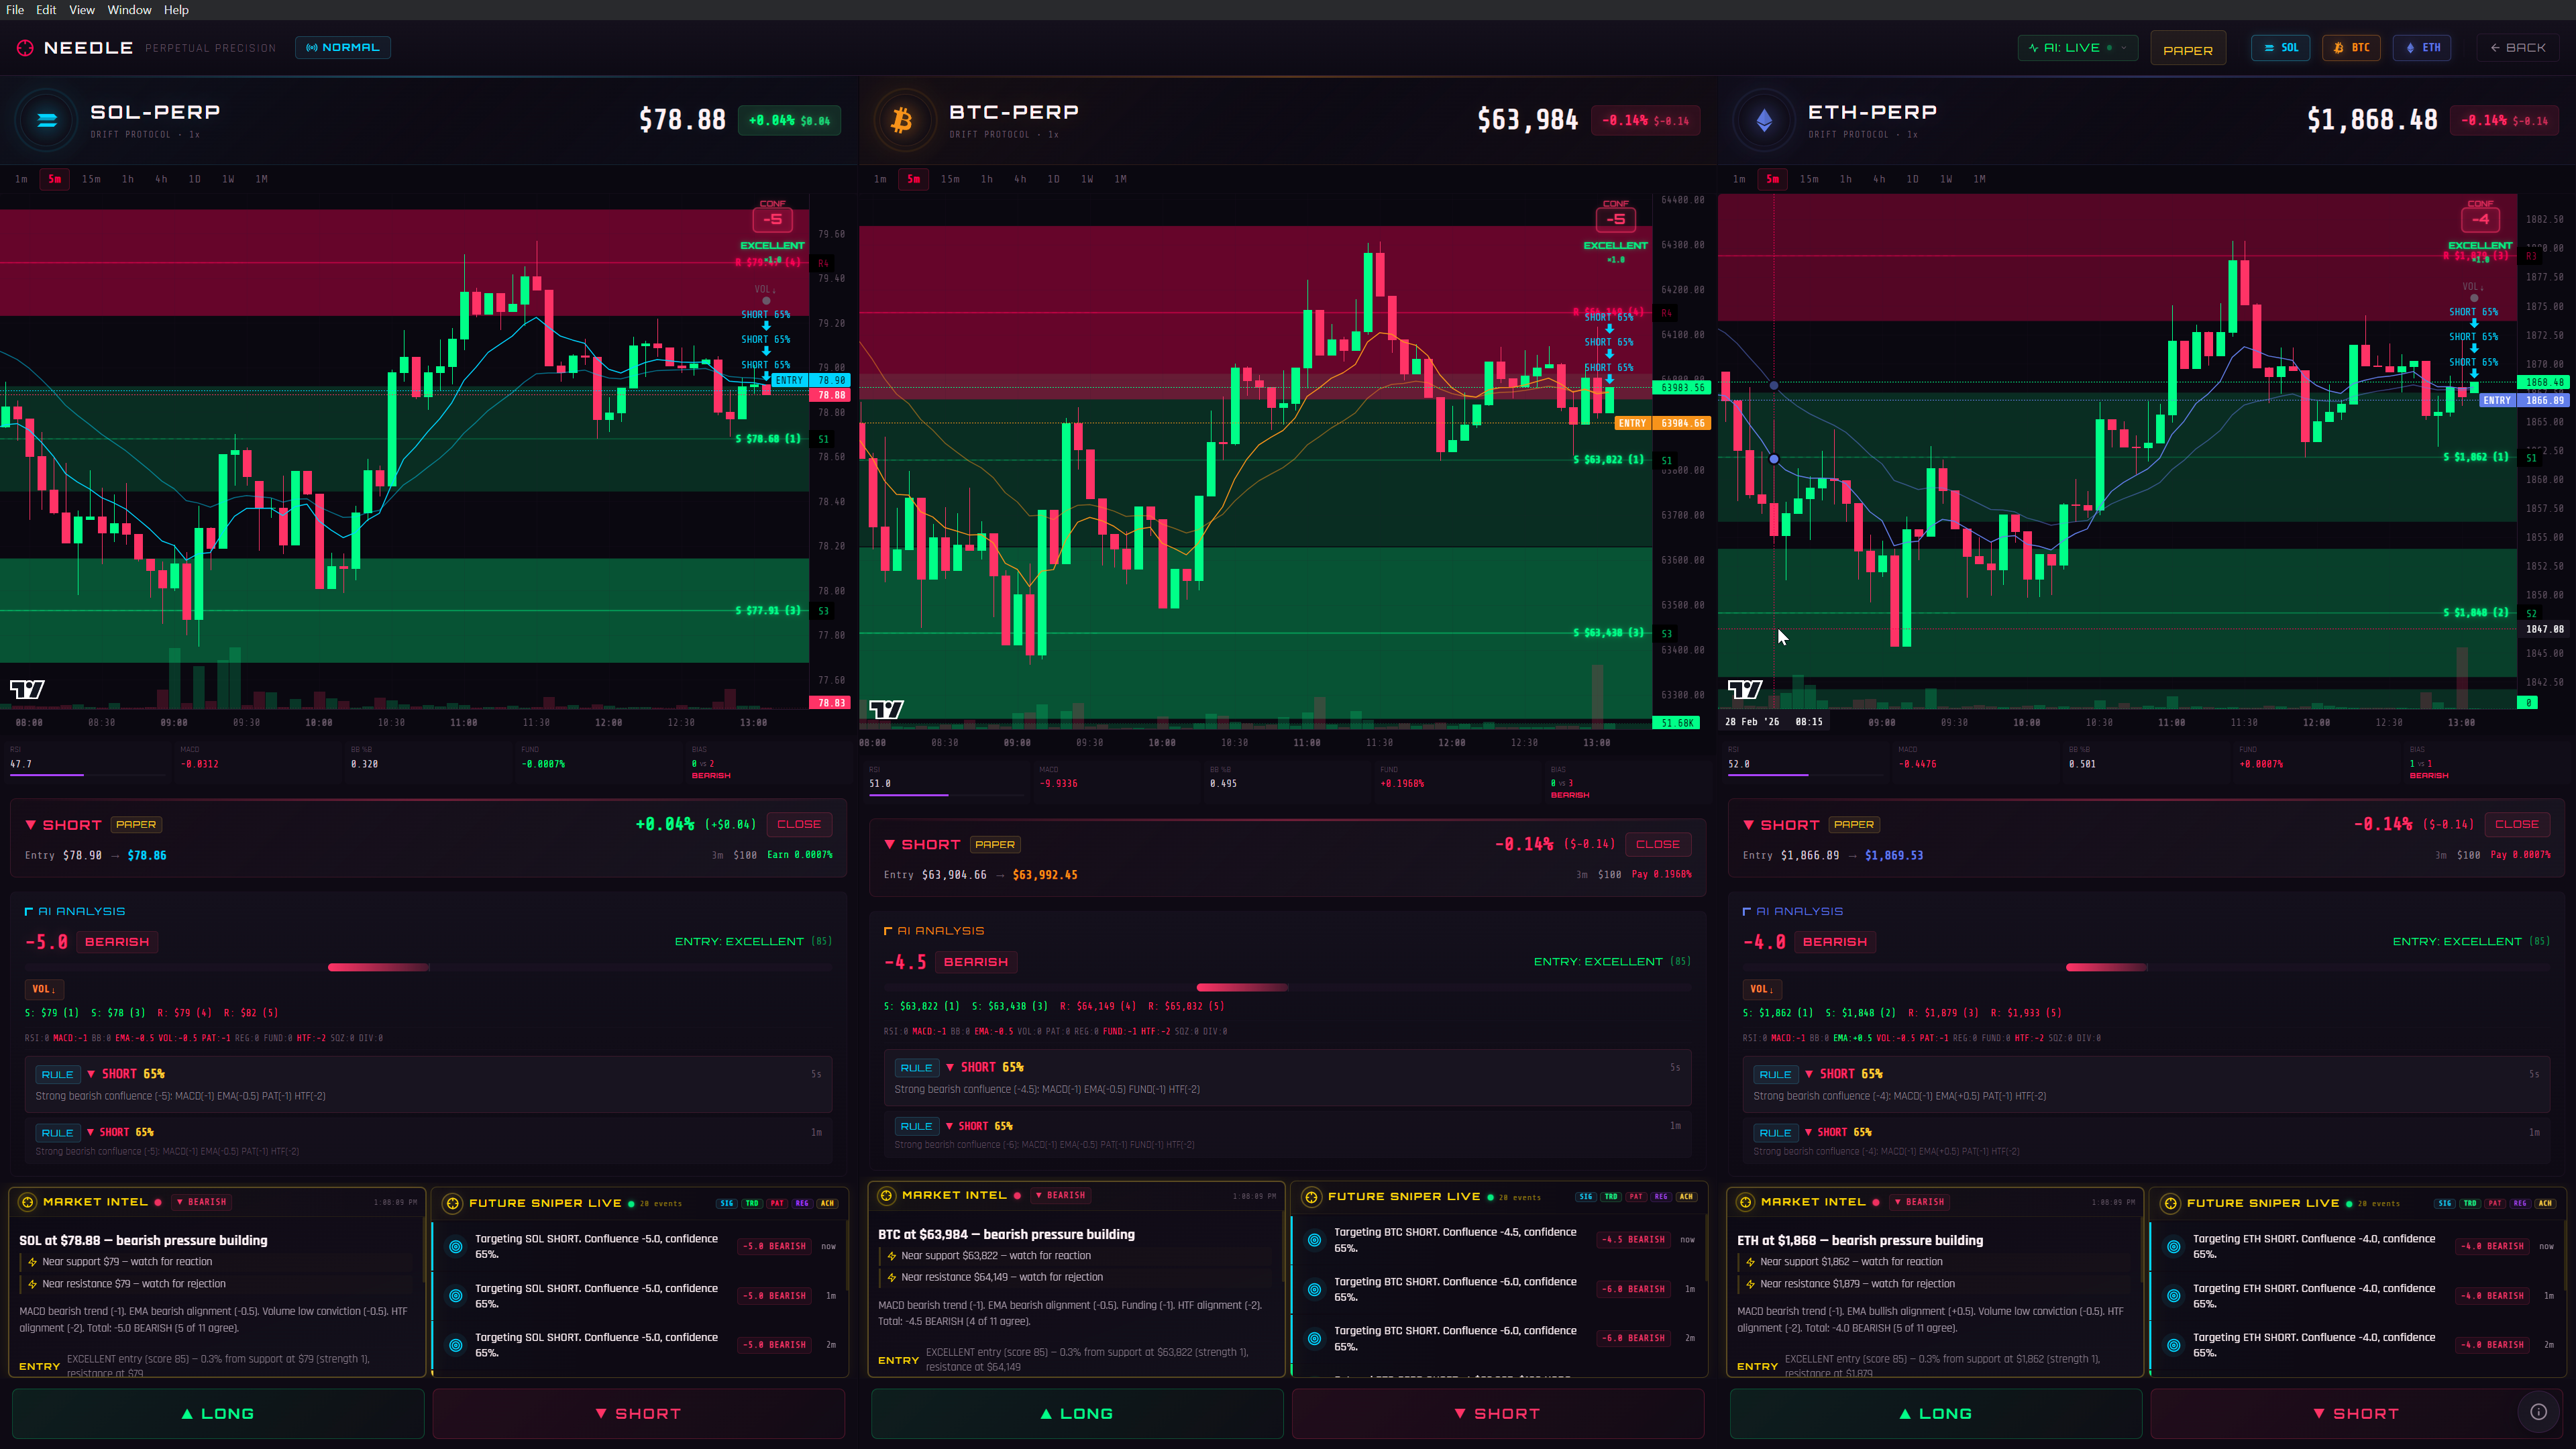
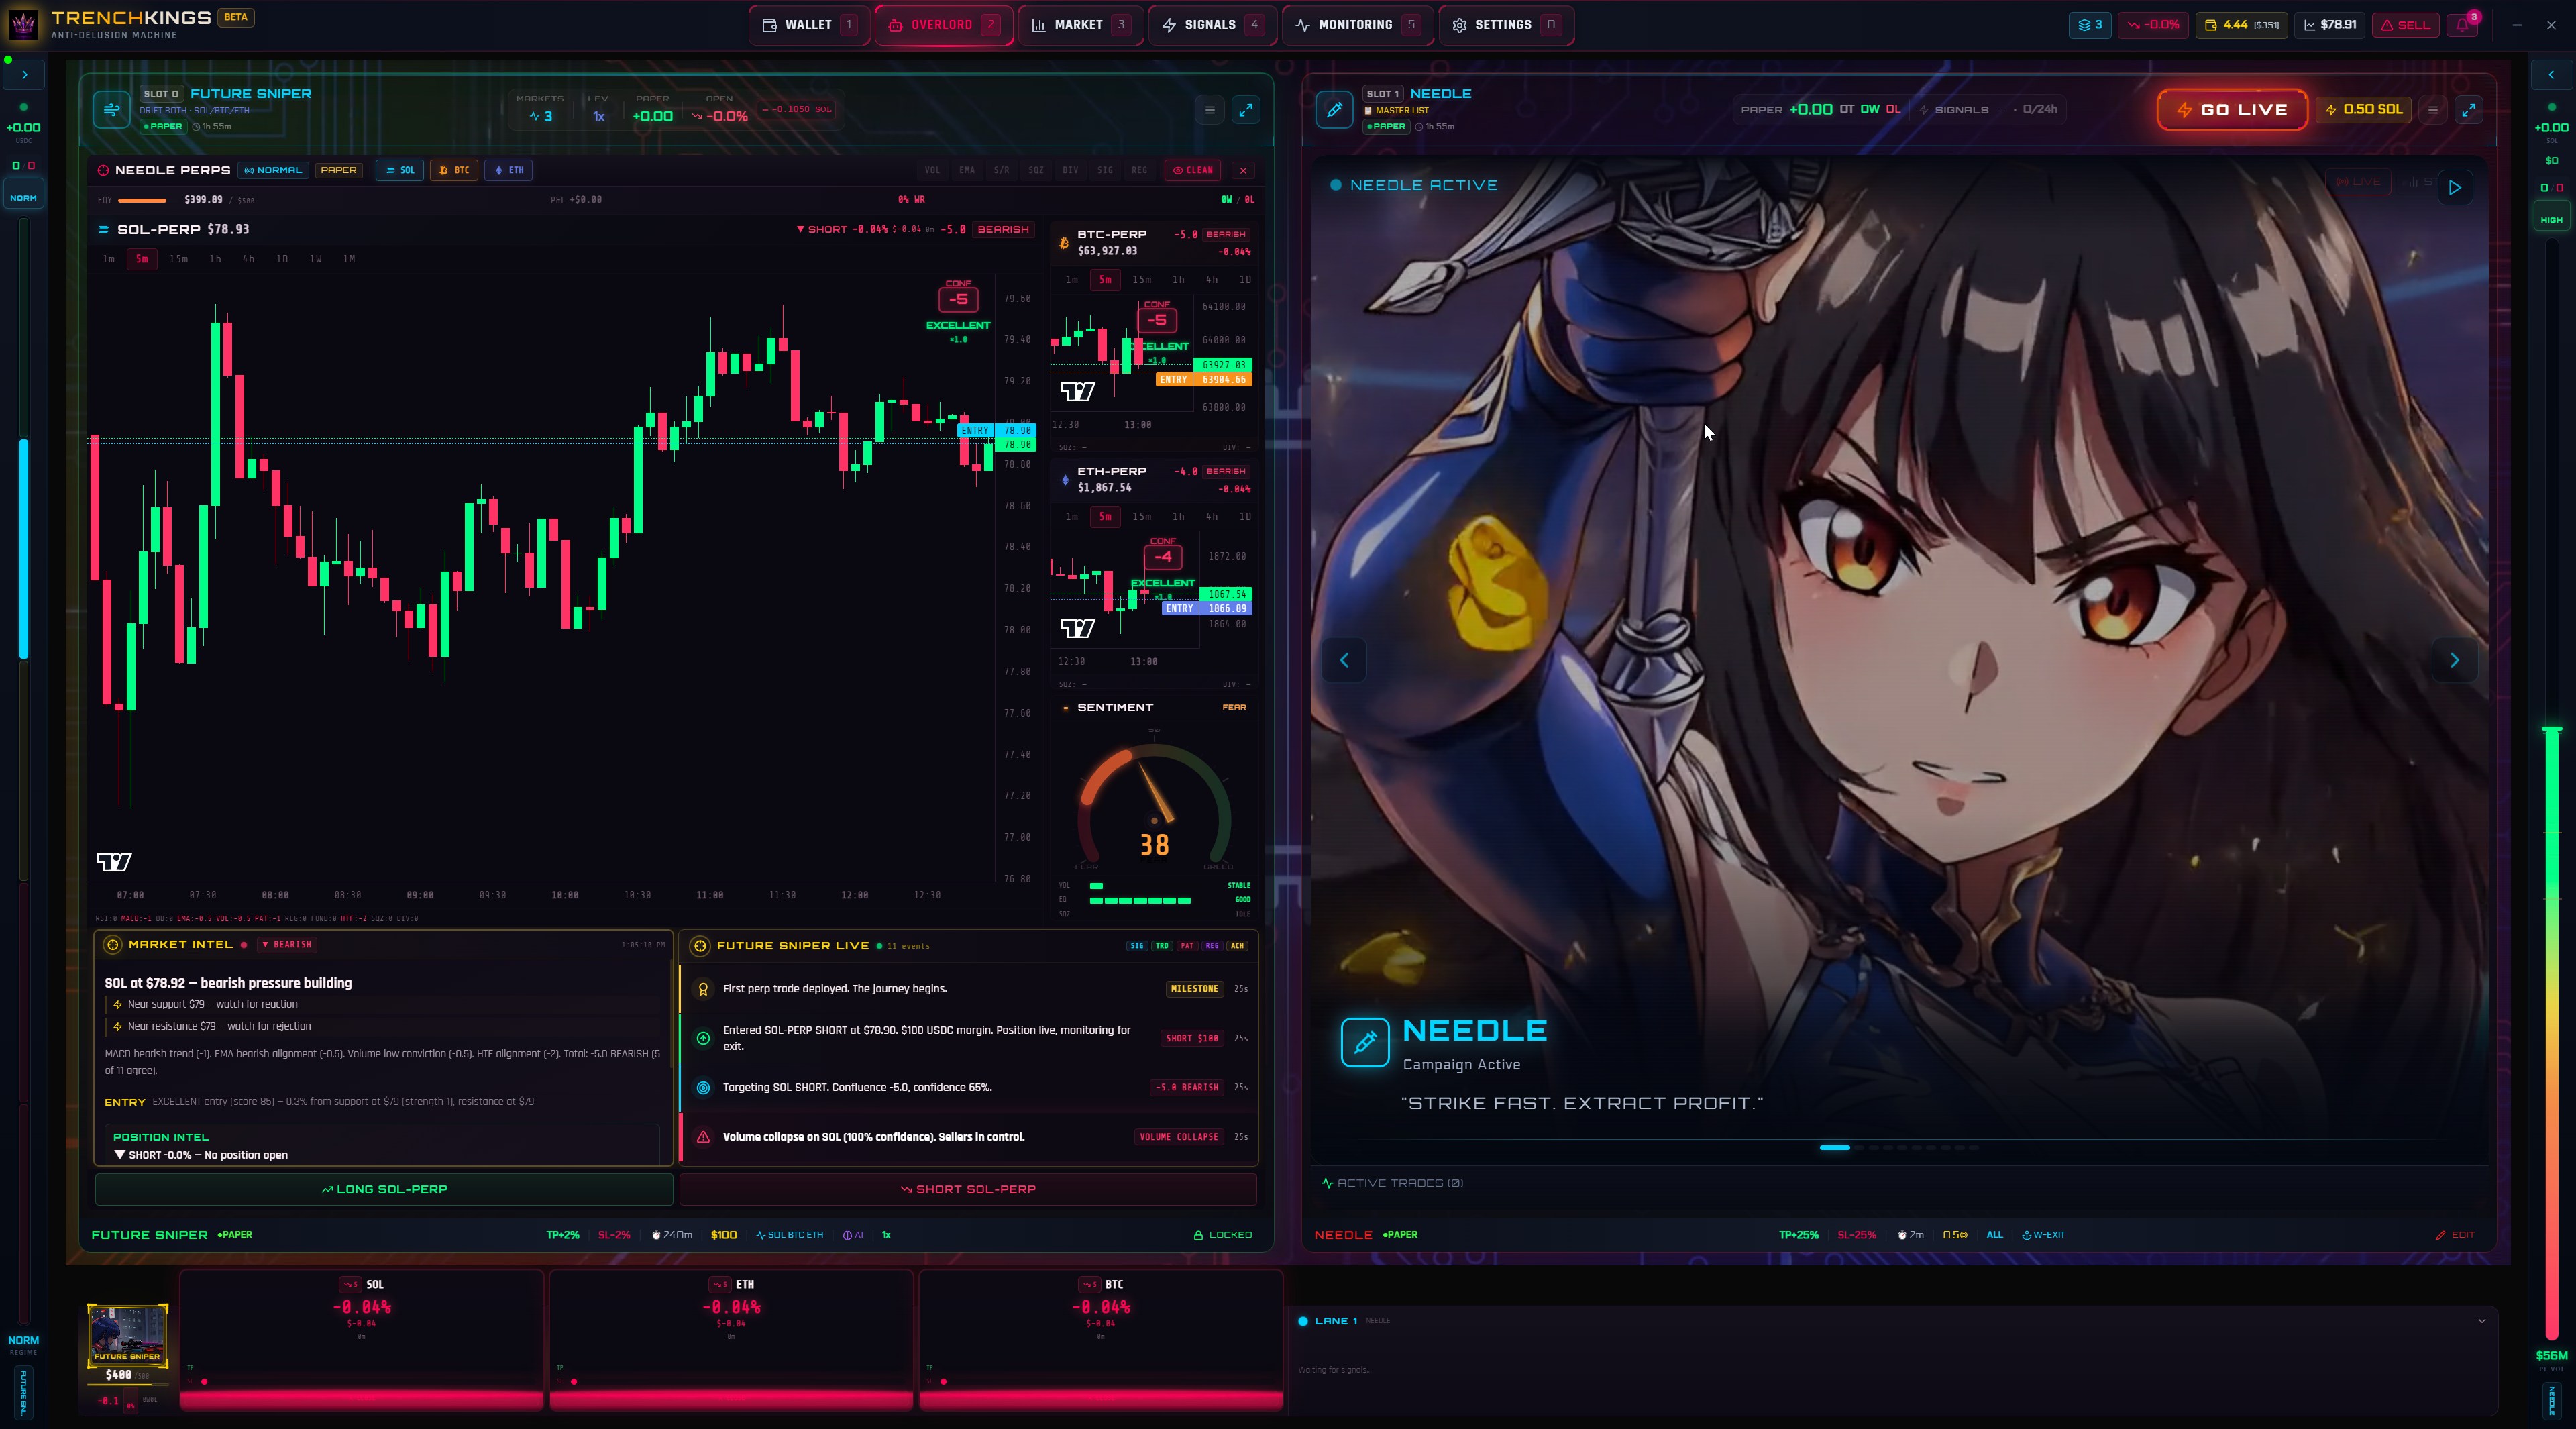
Live Positions + Bearish Detection
Active SHORT positions across multiple markets. BEARISH confluence (-5.0, -4.5, -4.0), EXCELLENT entry grades, Market Intel showing "bearish pressure building".
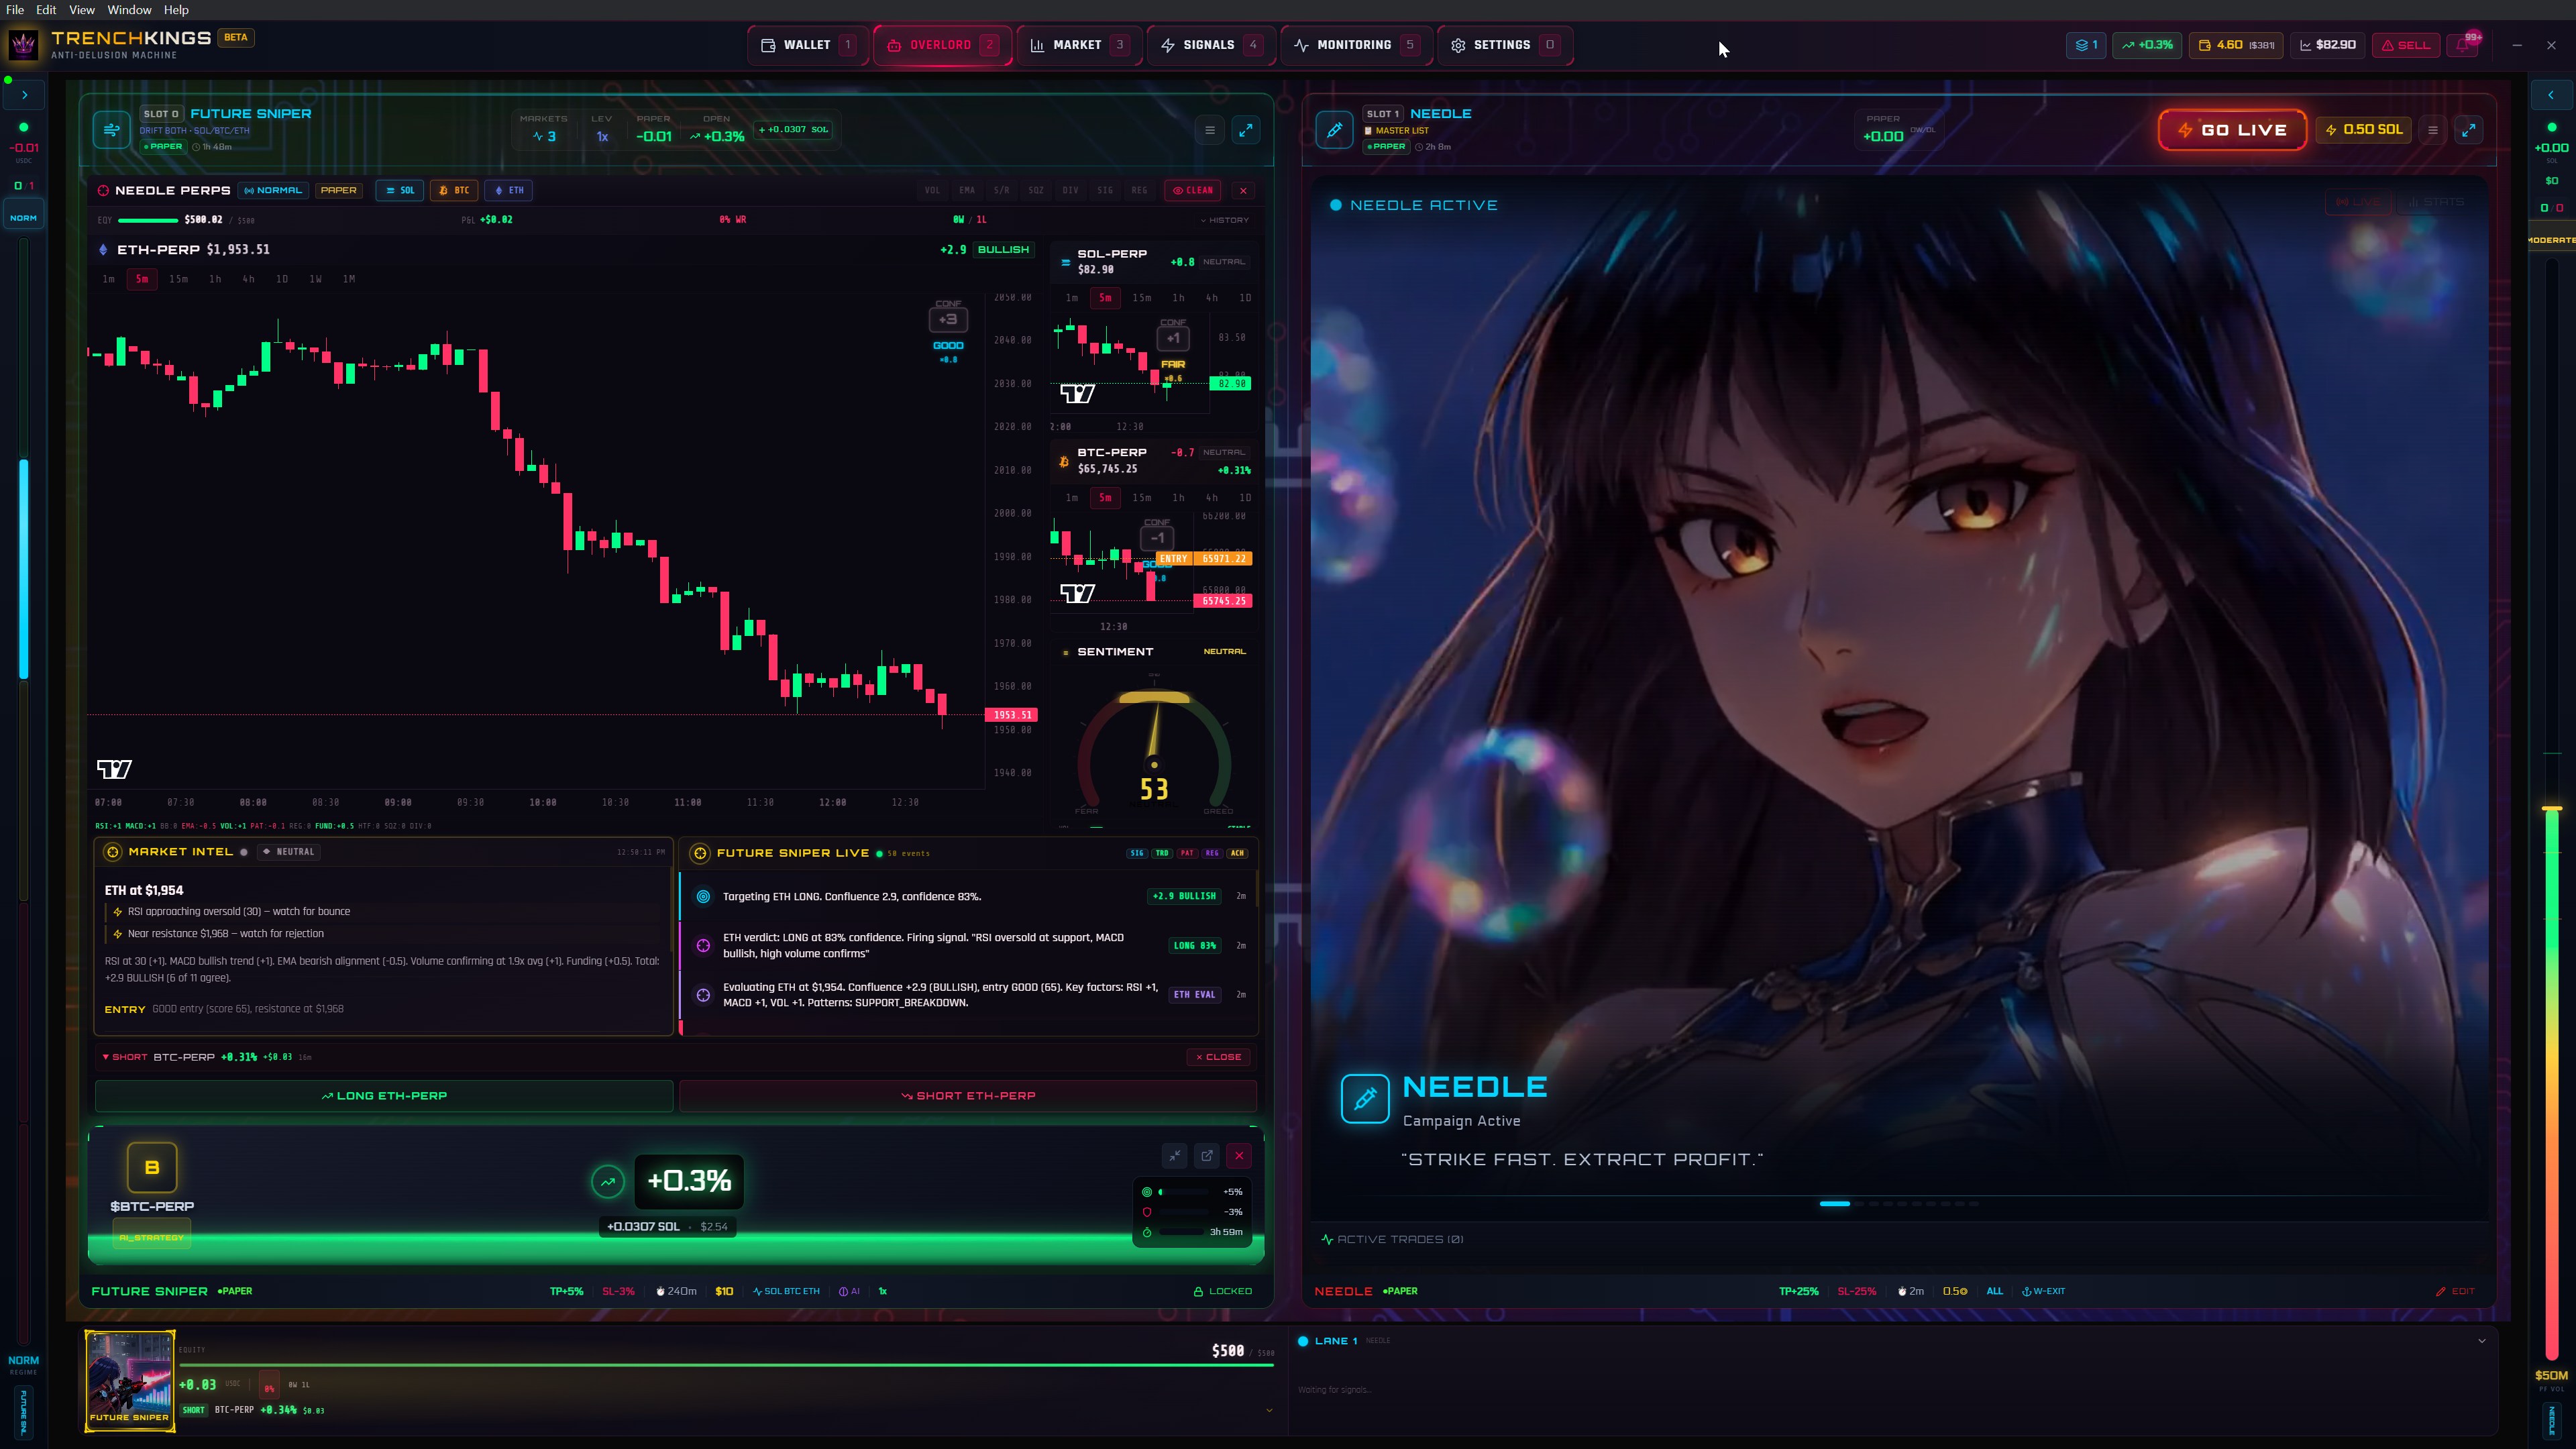
Dual-Lane Campaign System
Left lane: FUTURE SNIPER with ETH-PERP chart, sentiment gauge (53), market intel. Right lane: NEEDLE campaign with anime portrait. BTC position card at +0.3%.
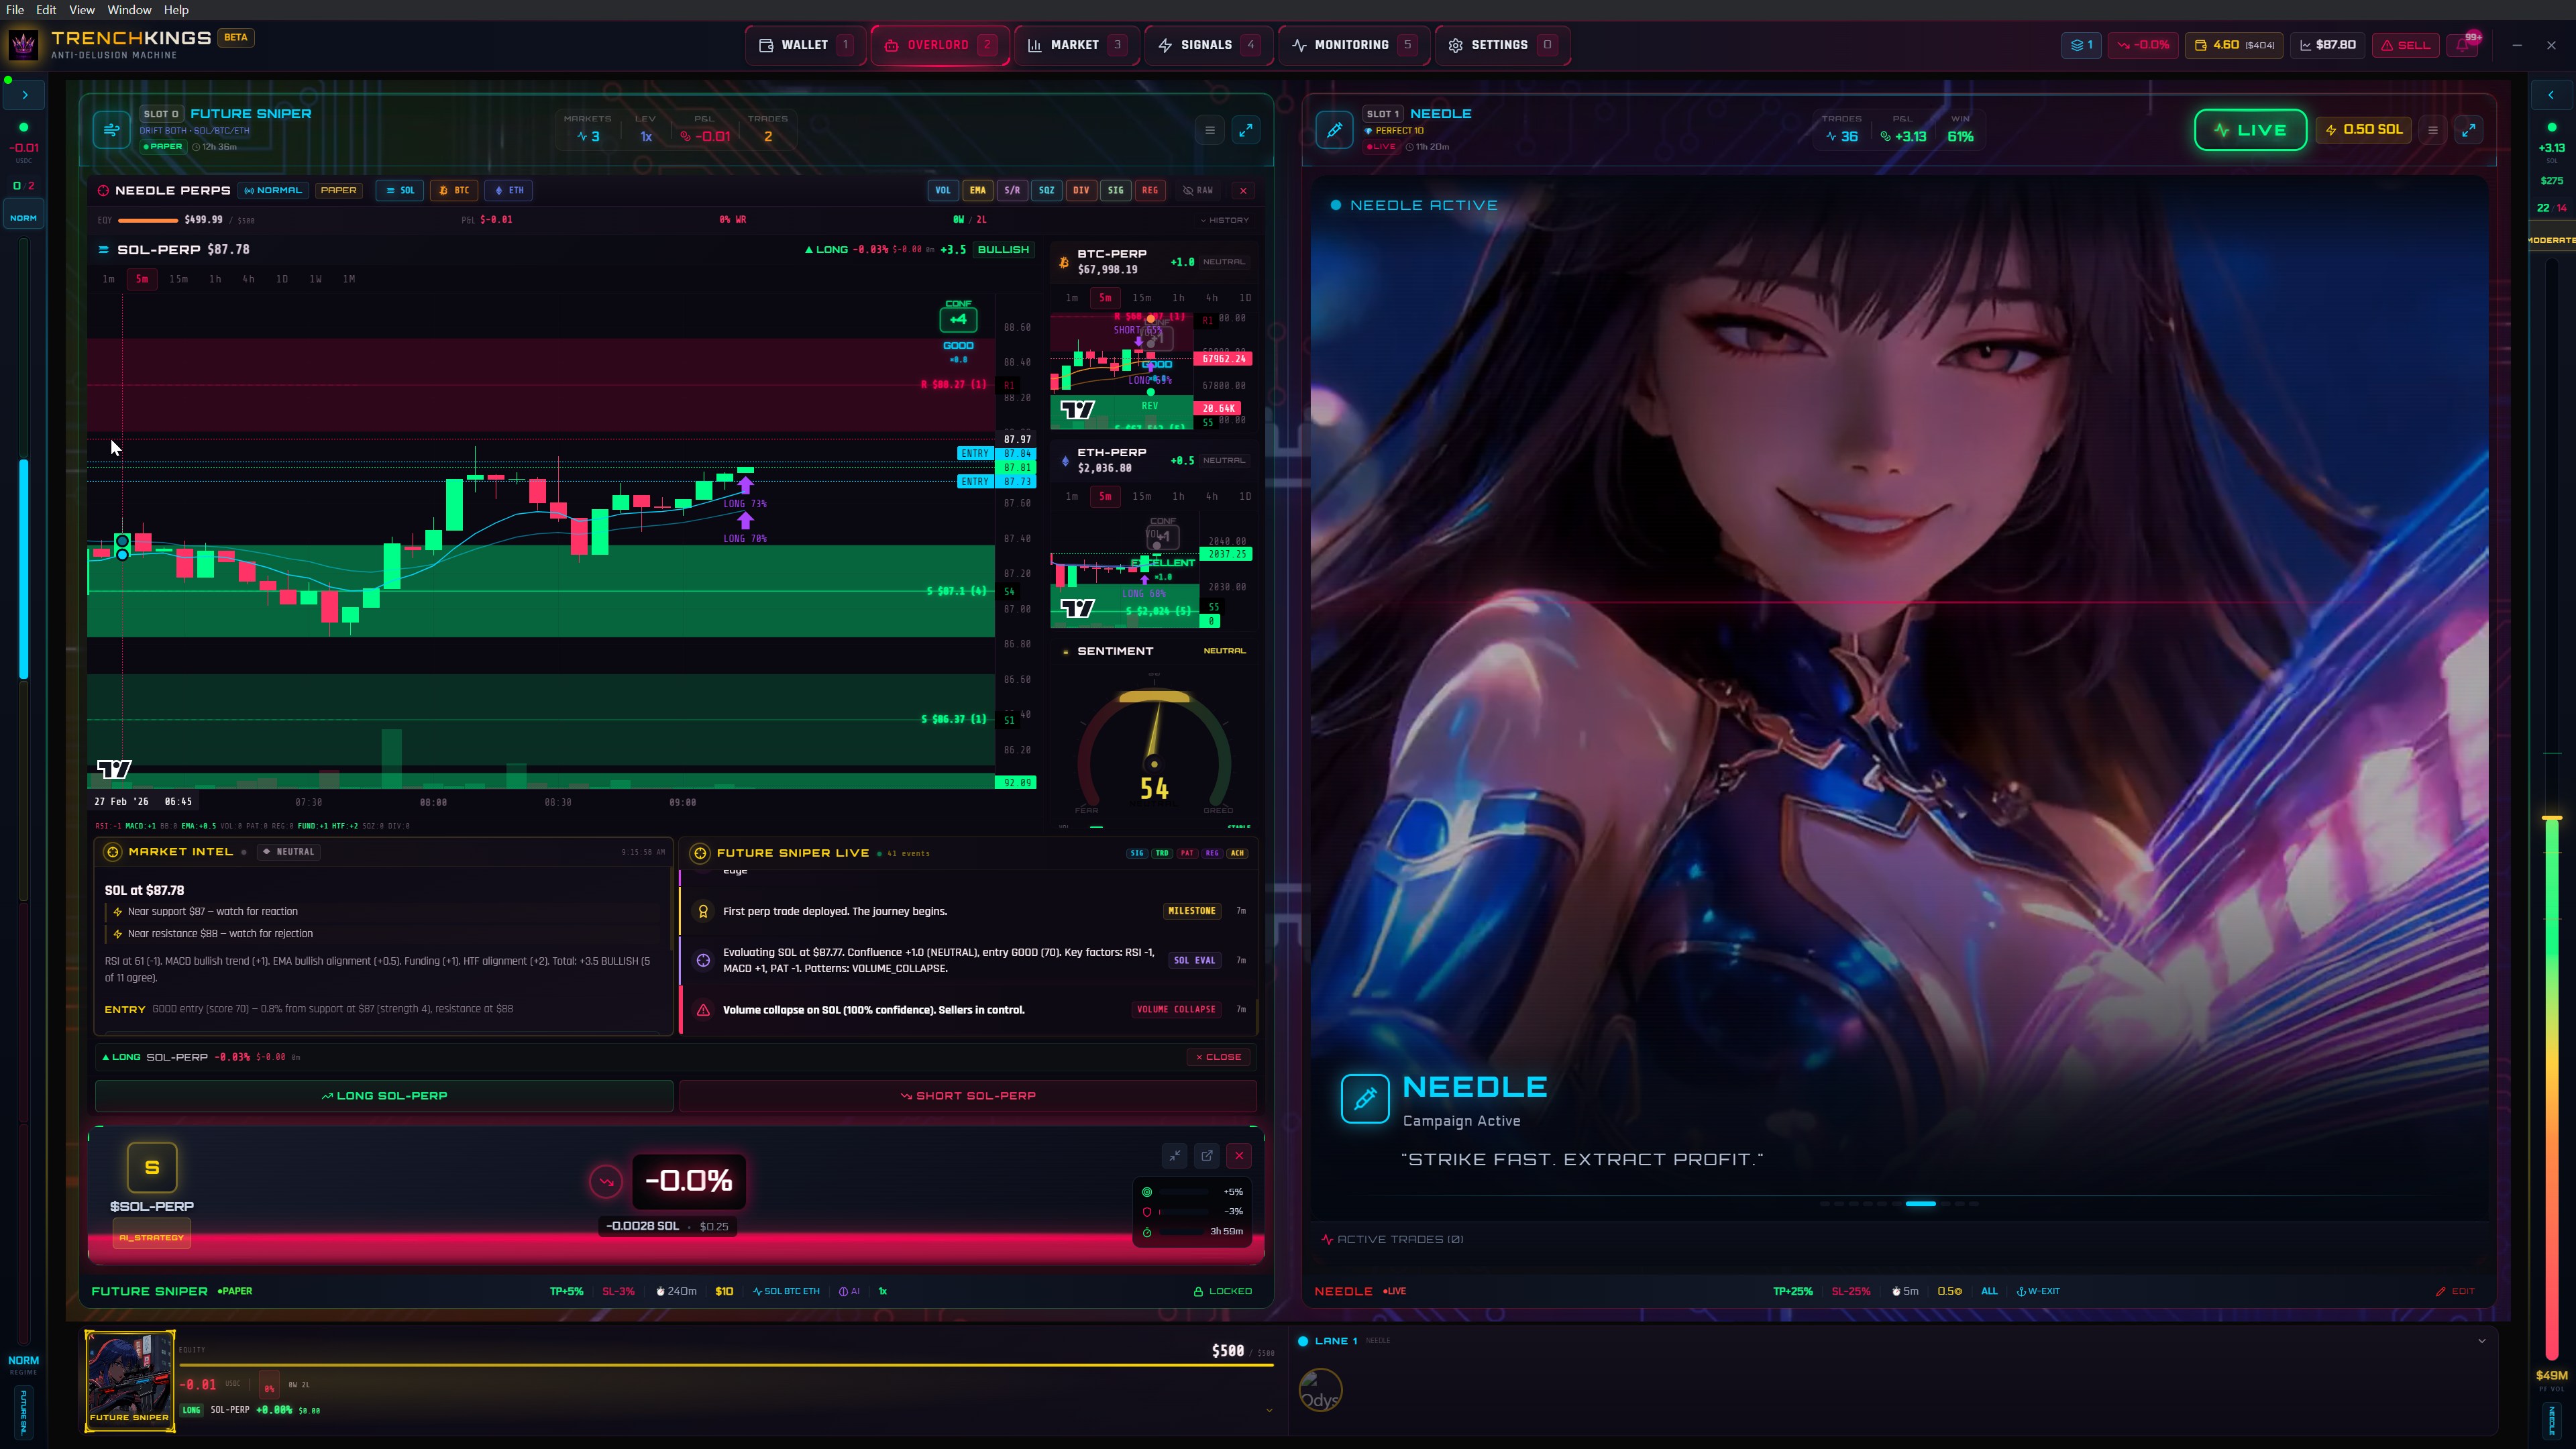
AI-Powered Autonomy
SOL-PERP analysis with sentiment gauge (54), market intel with support/resistance, and FUTURE SNIPER LIVE feed showing "First perp trade deployed. The journey begins."
Multi-Position Management
SOL-PERP focused chart with BTC/ETH minis (EXCELLENT entry grades), sentiment gauge at 38 (FEAR), 3 active position cards tracked simultaneously.
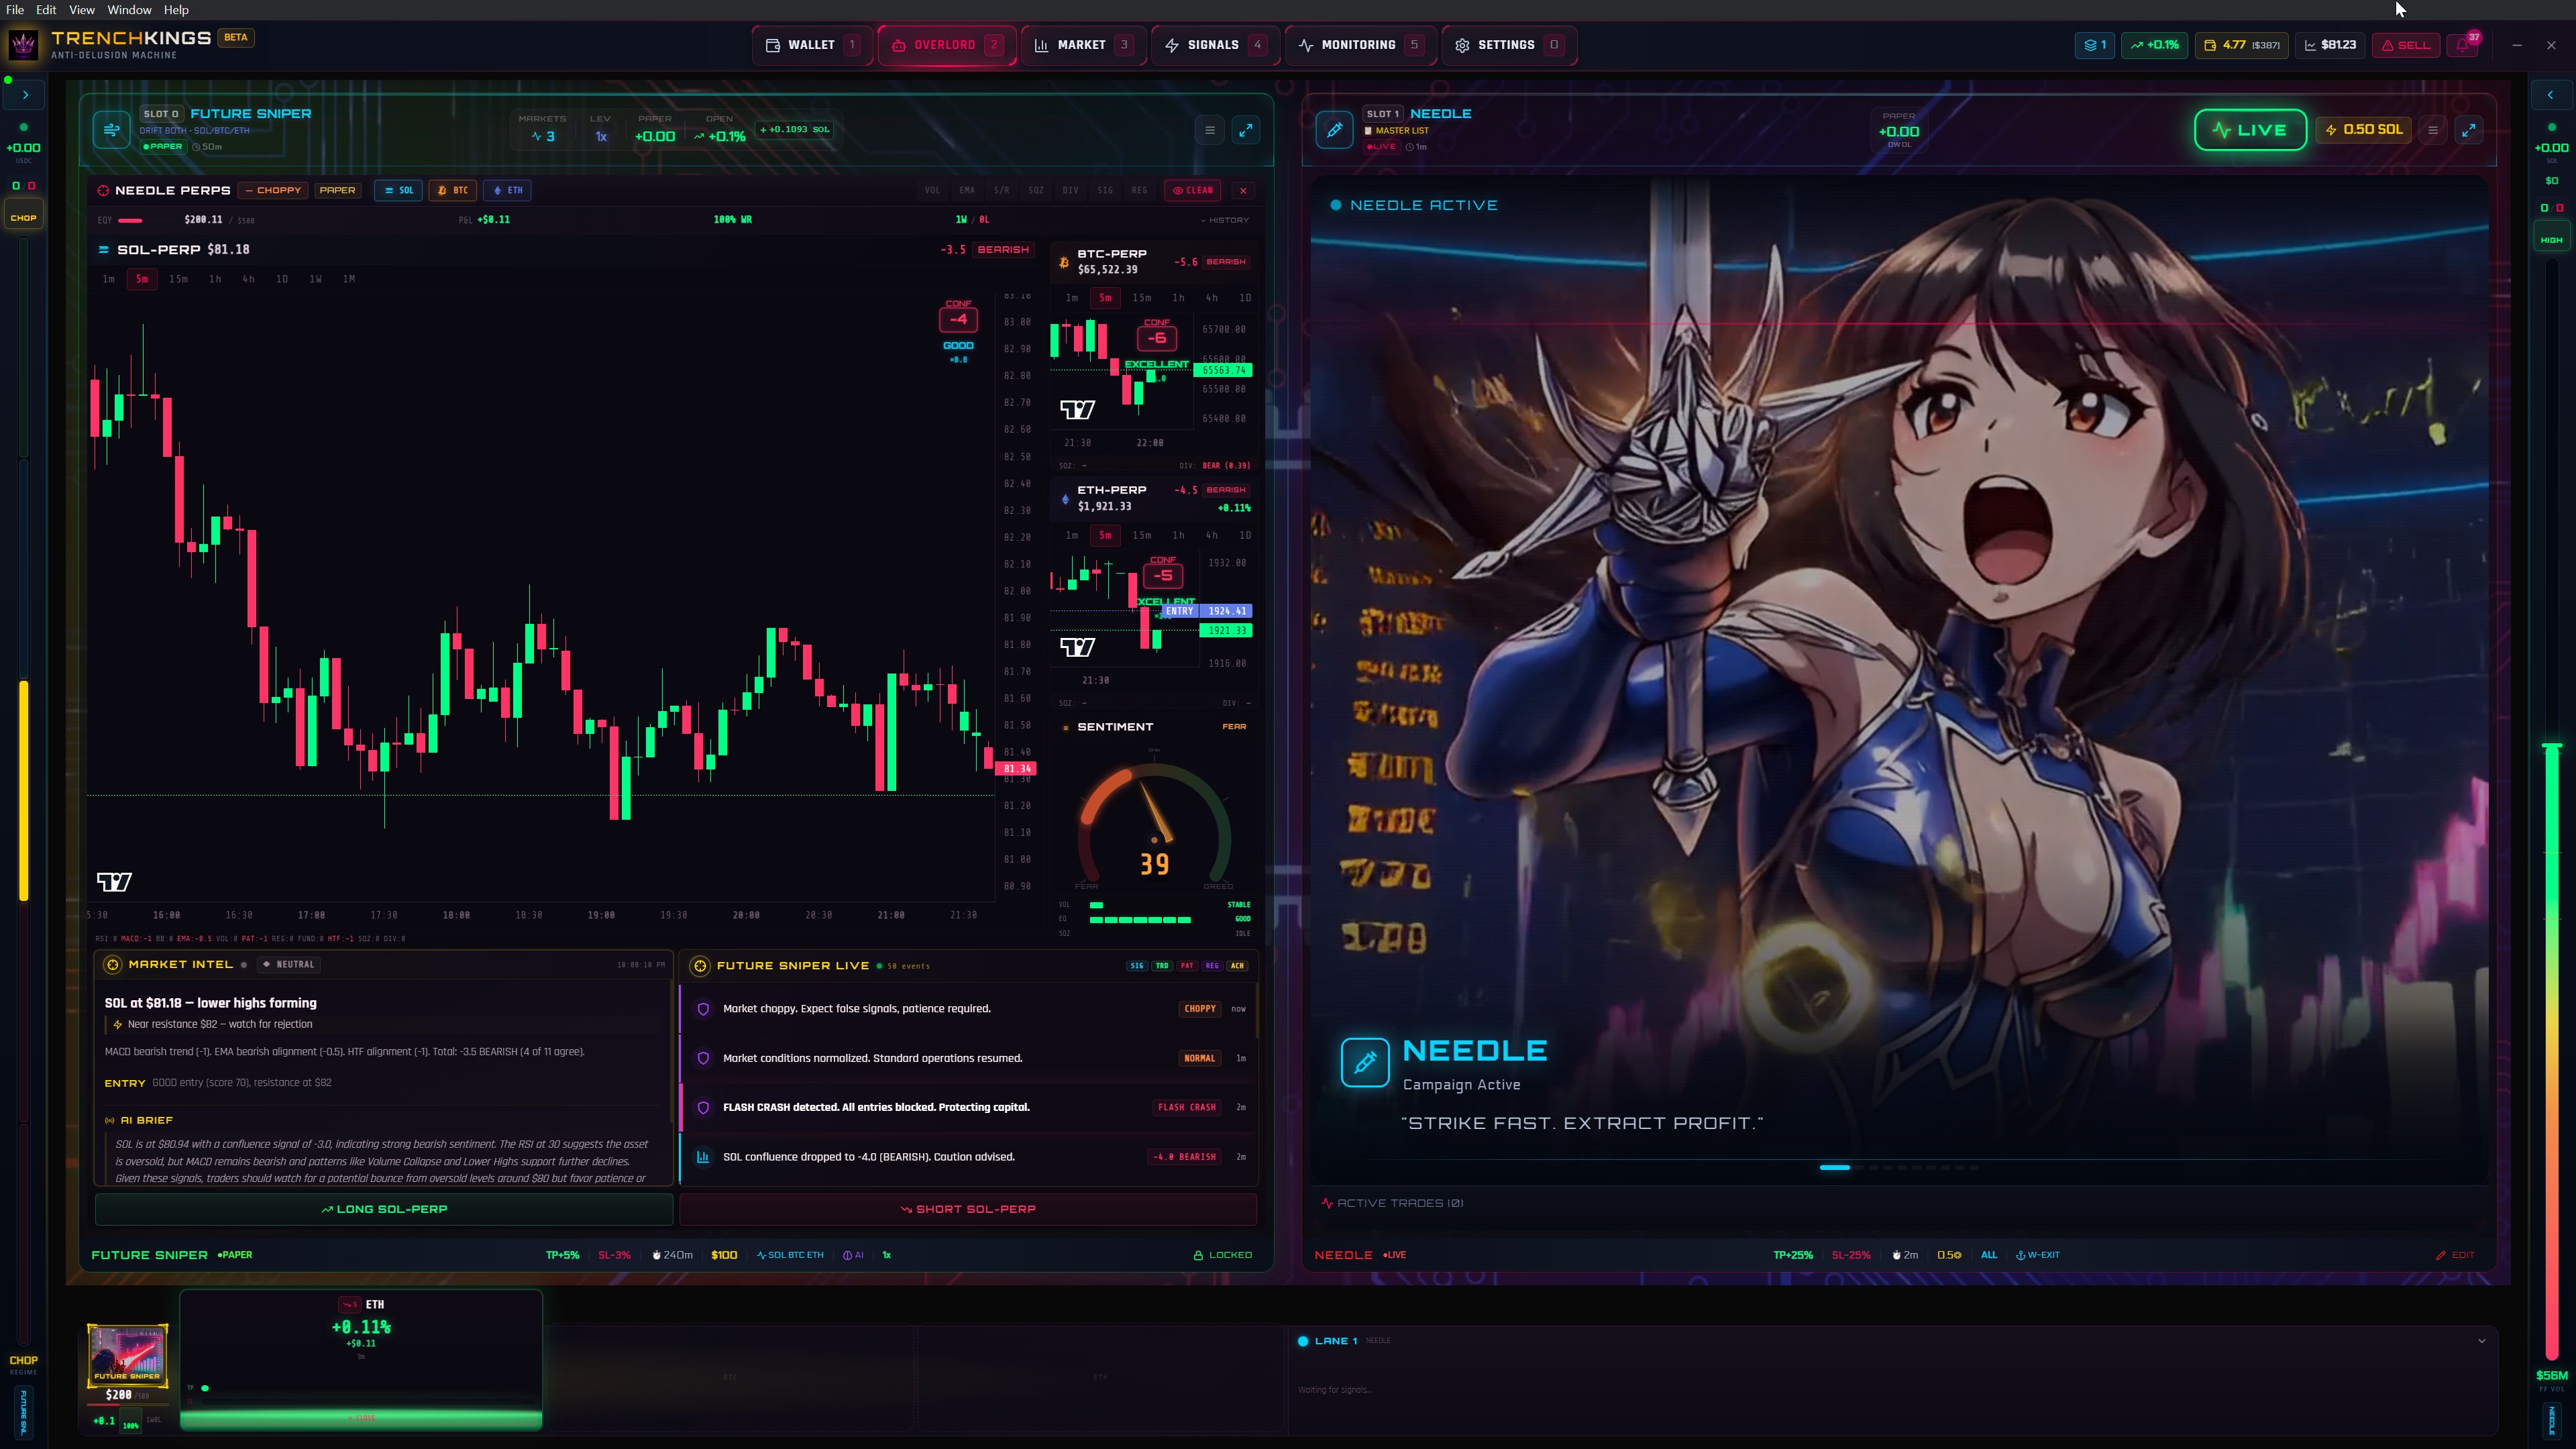
Flash Crash Protection
AI detects FLASH_CRASH regime. All entries blocked. Confluence drops to -4.0. Sentiment gauge at 39. The system protects capital when markets break down.
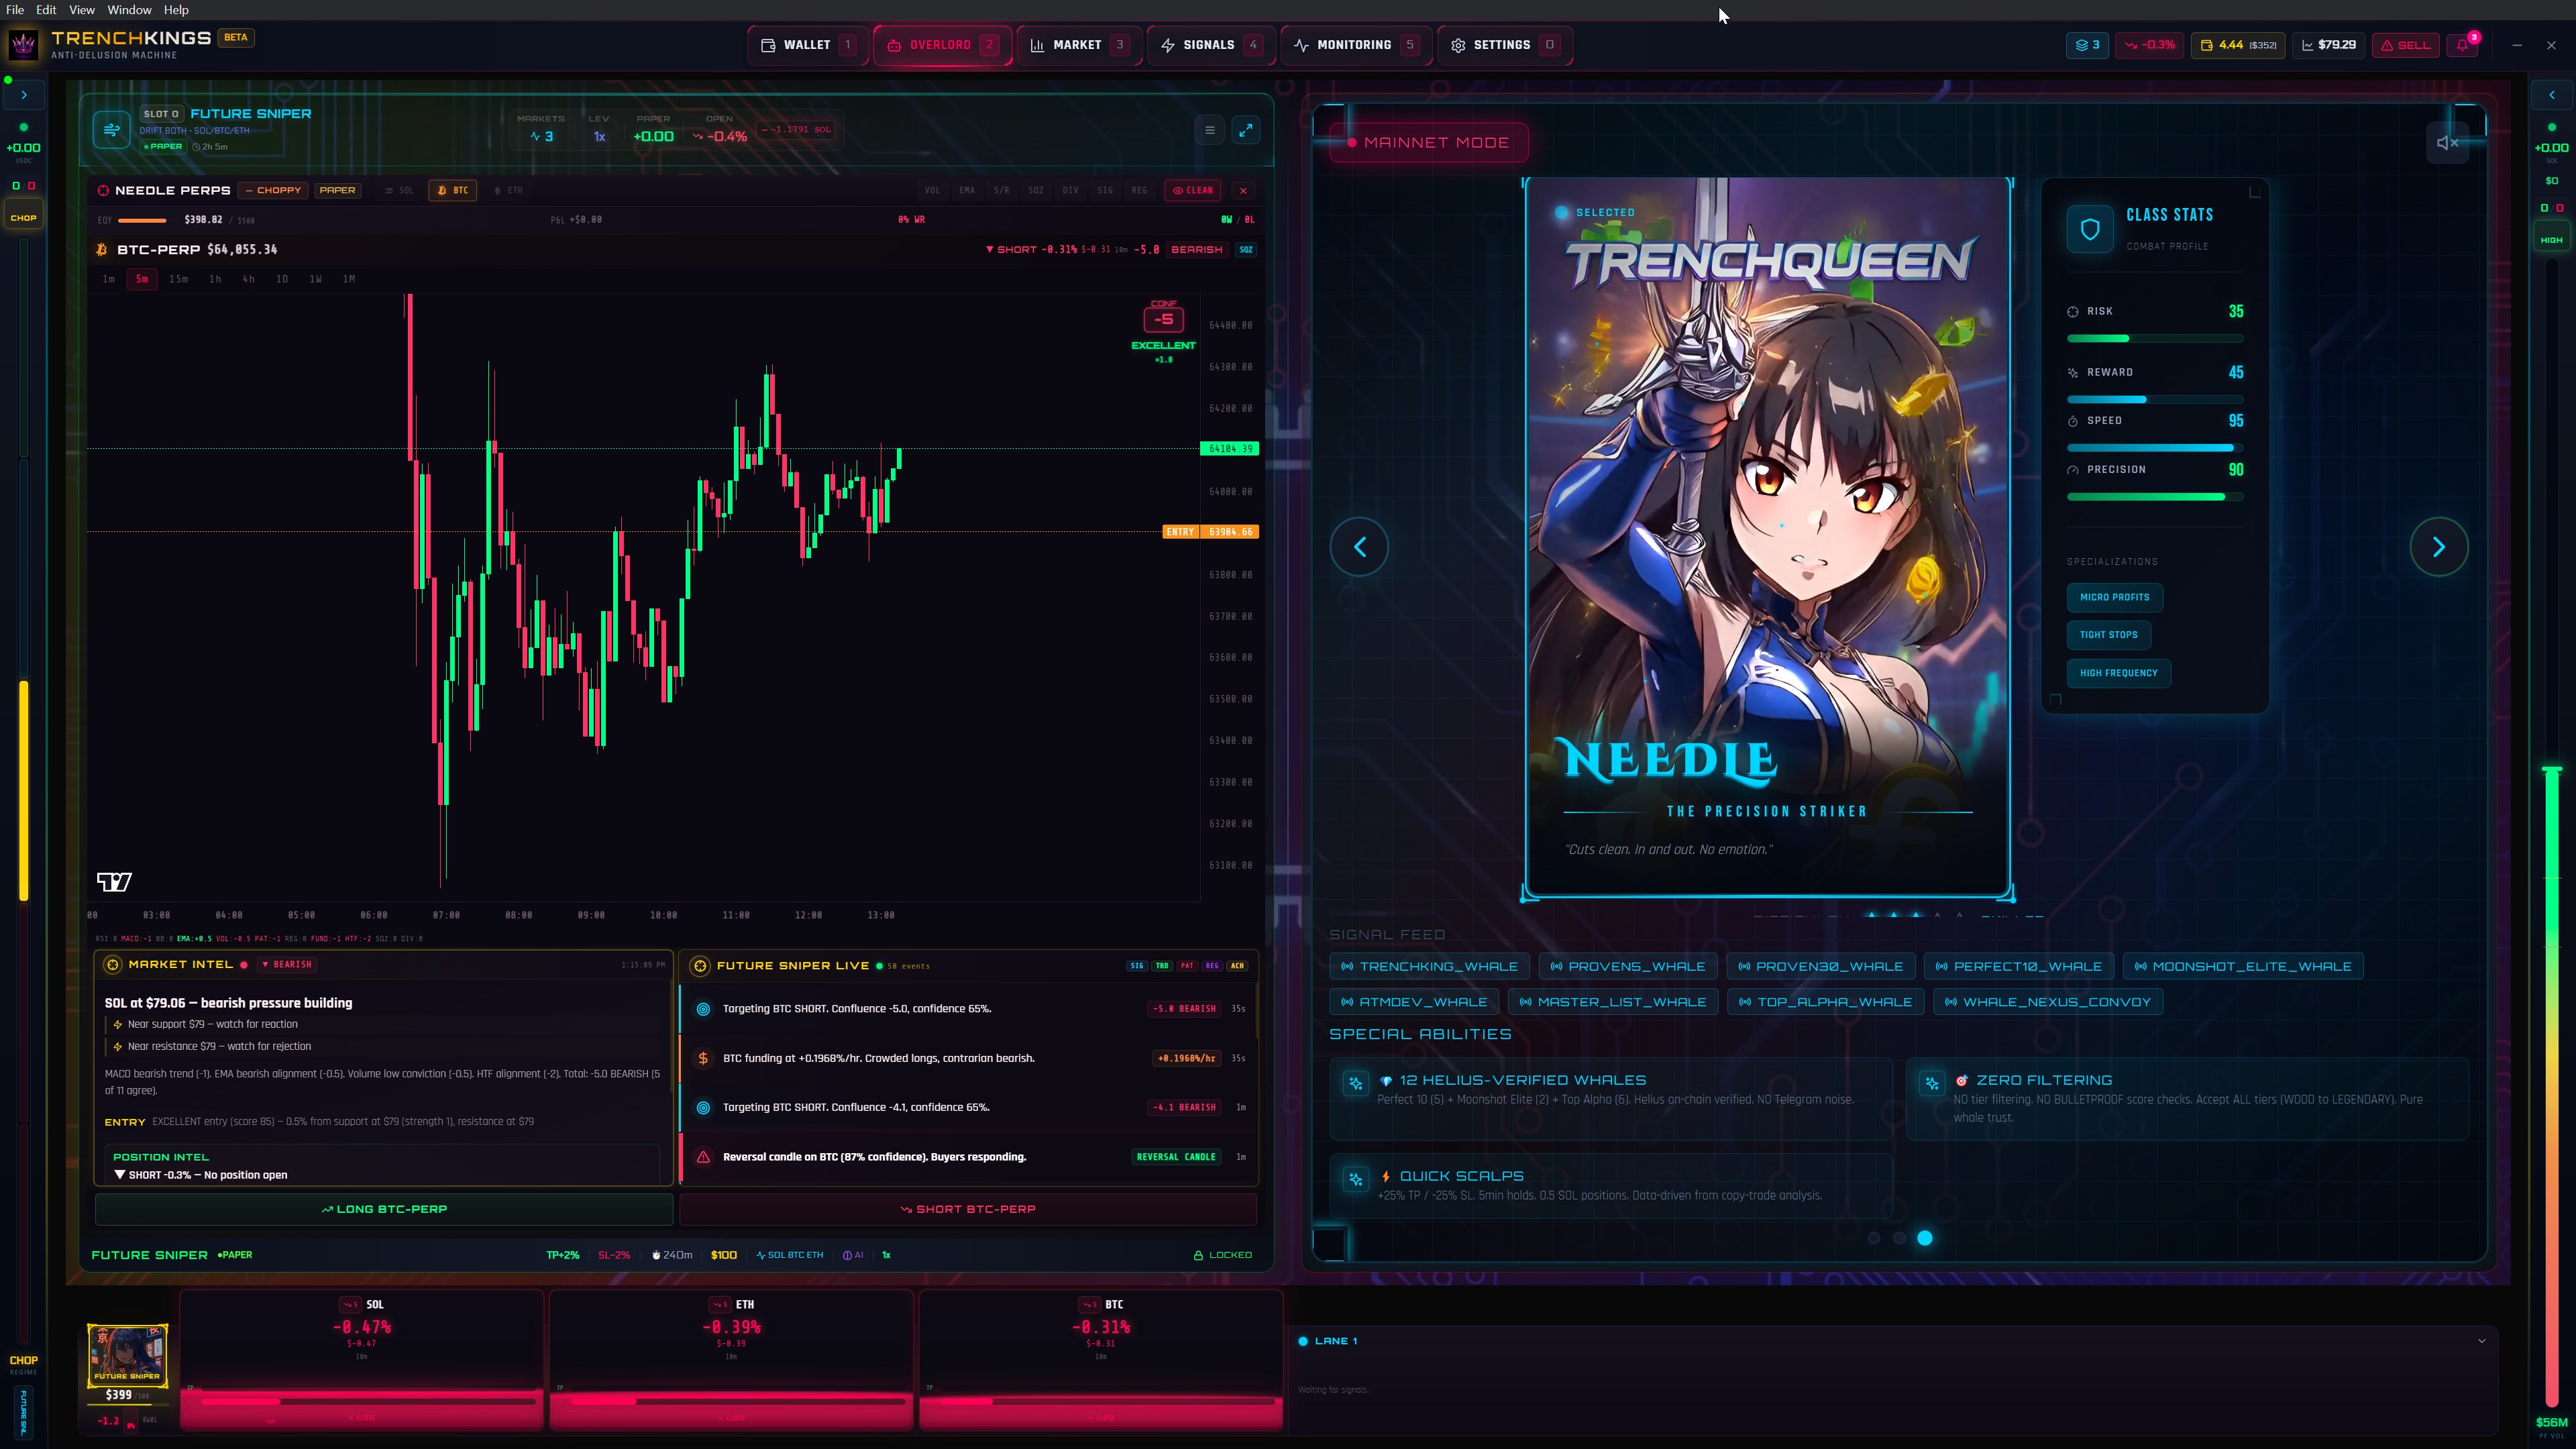
Overlord Command Center — BTC-PERP chart with Market Intel + FUTURE SNIPER LIVE signals. Archetype selector showing TRENCHQUEEN with class stats. Whale bucket signal feed with 12 Helius-verified sources. 3 perp positions tracked in bottom bar.
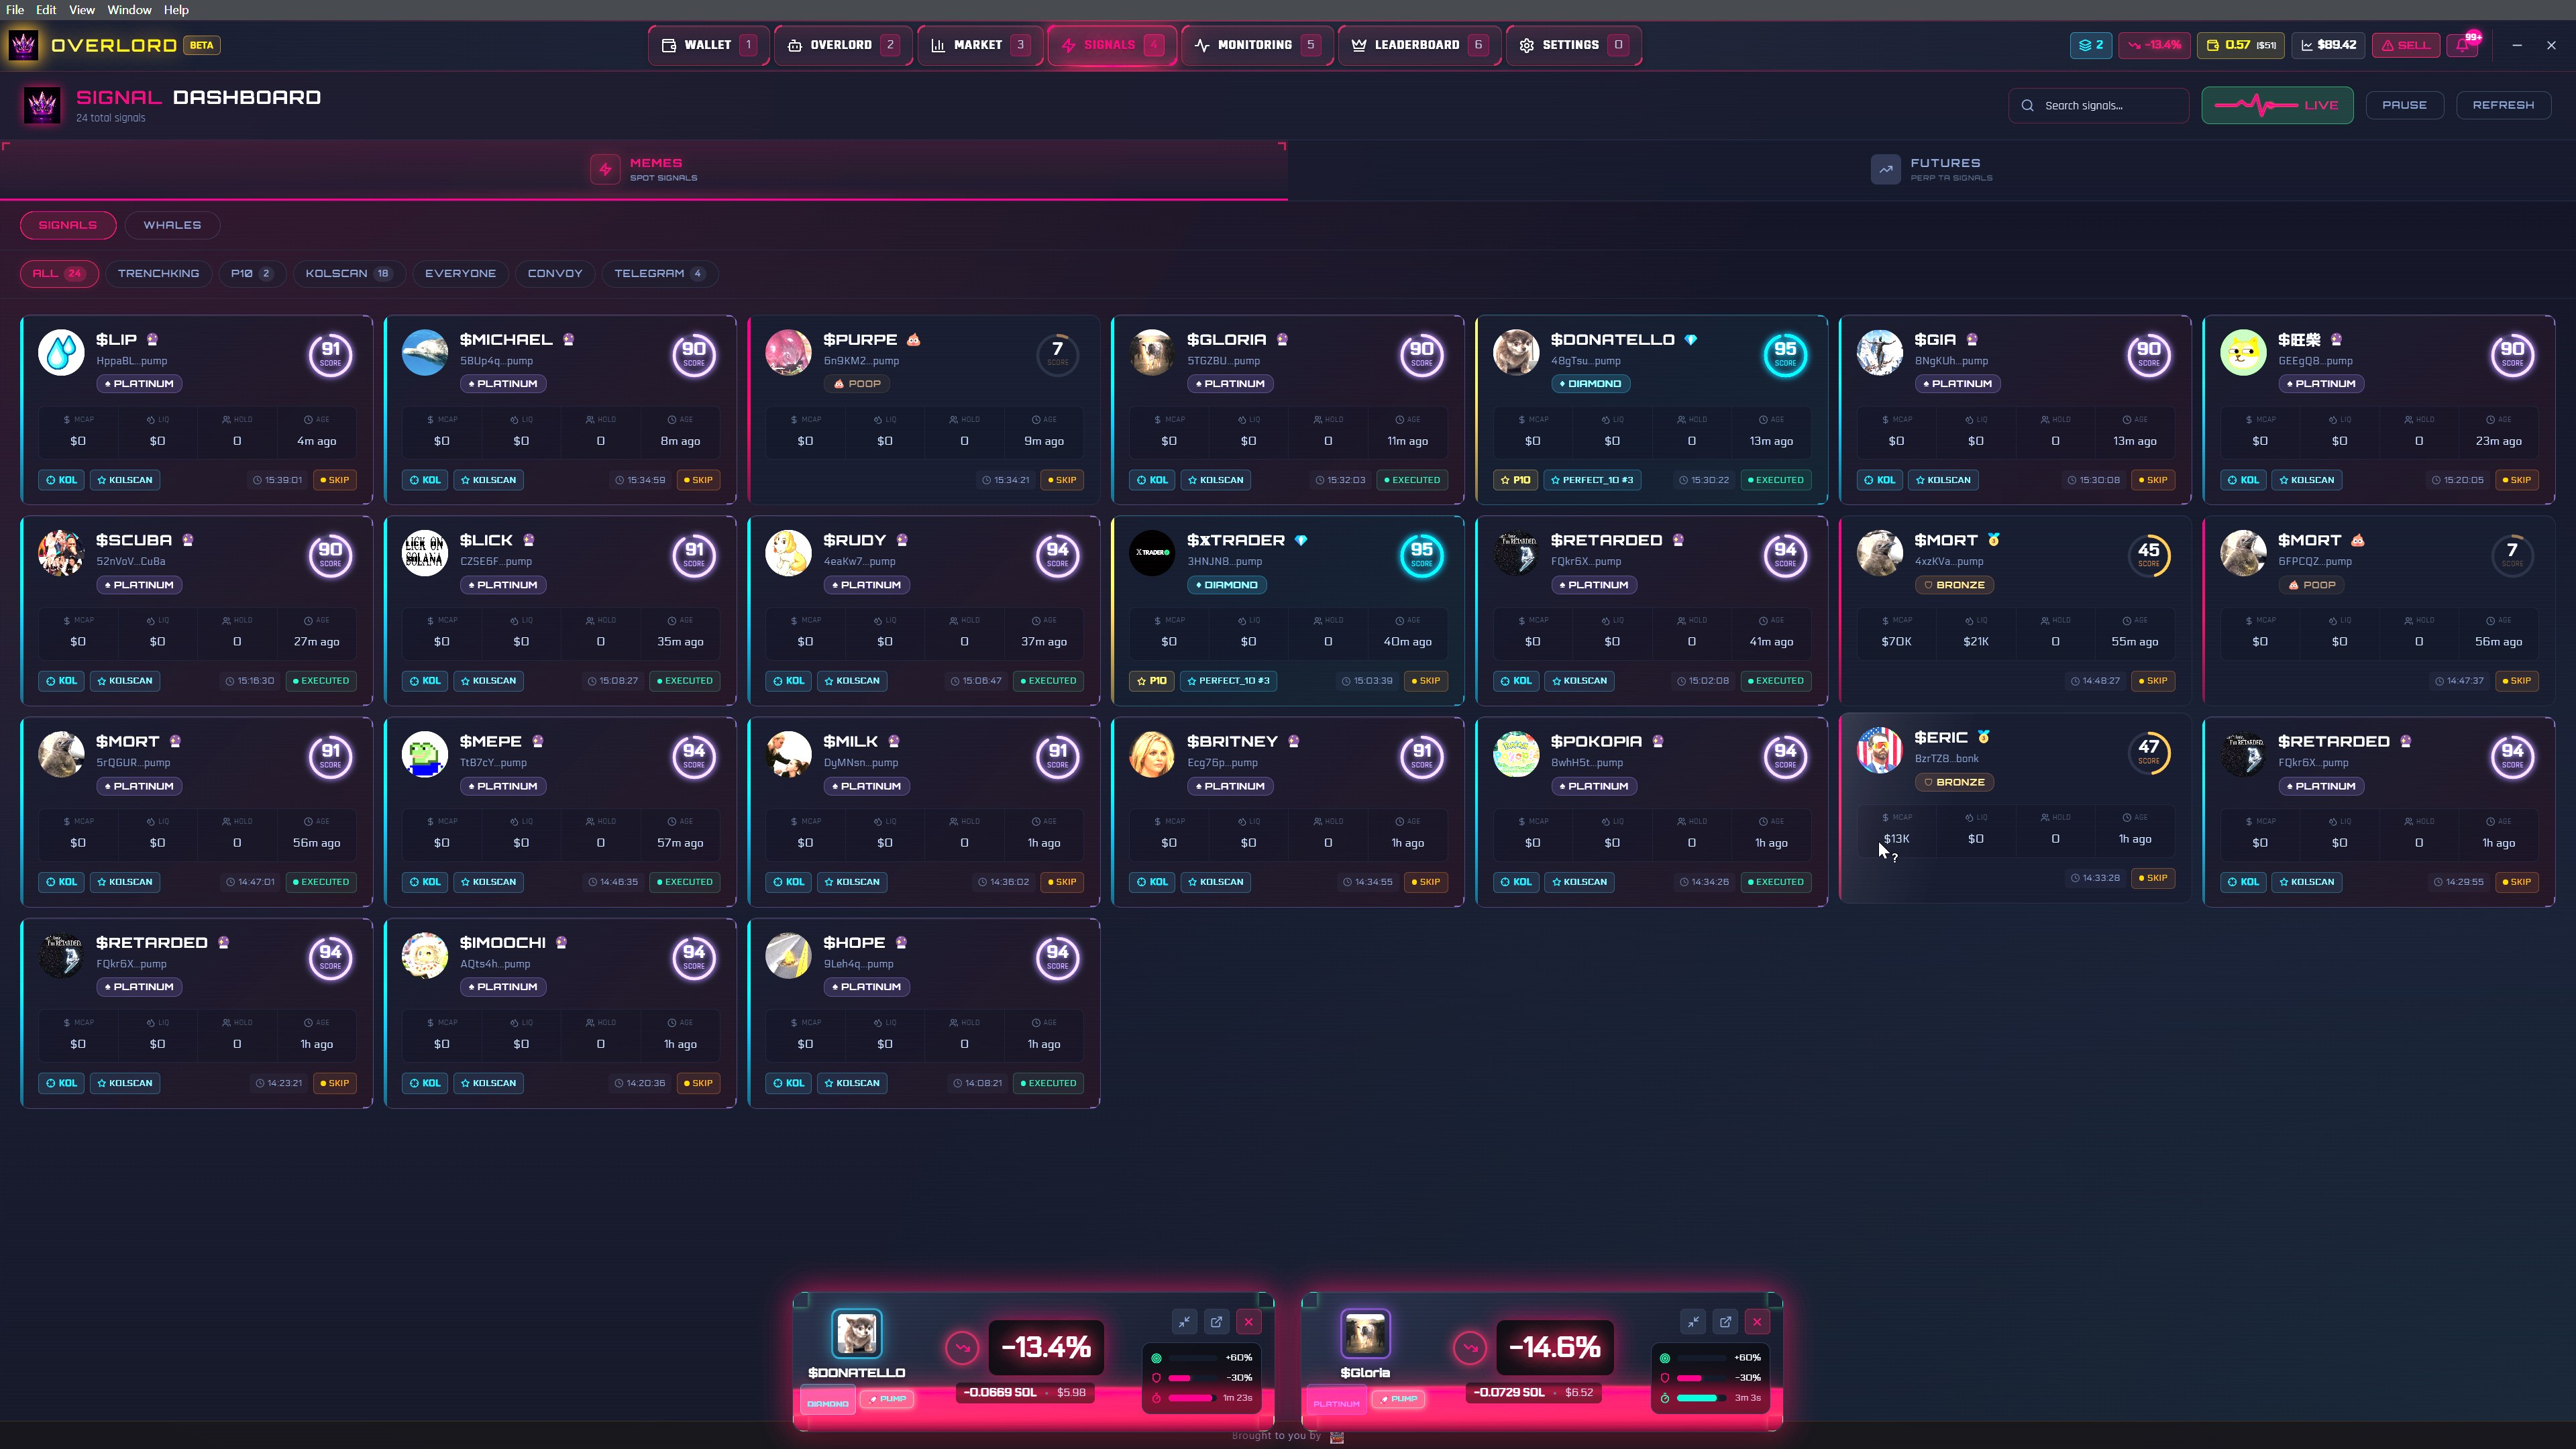
Signal Dashboard
24 live signals across KOLSCAN, P10, and TRENCHKING whale buckets. Real-time scoring, execution status, and convoy detection.
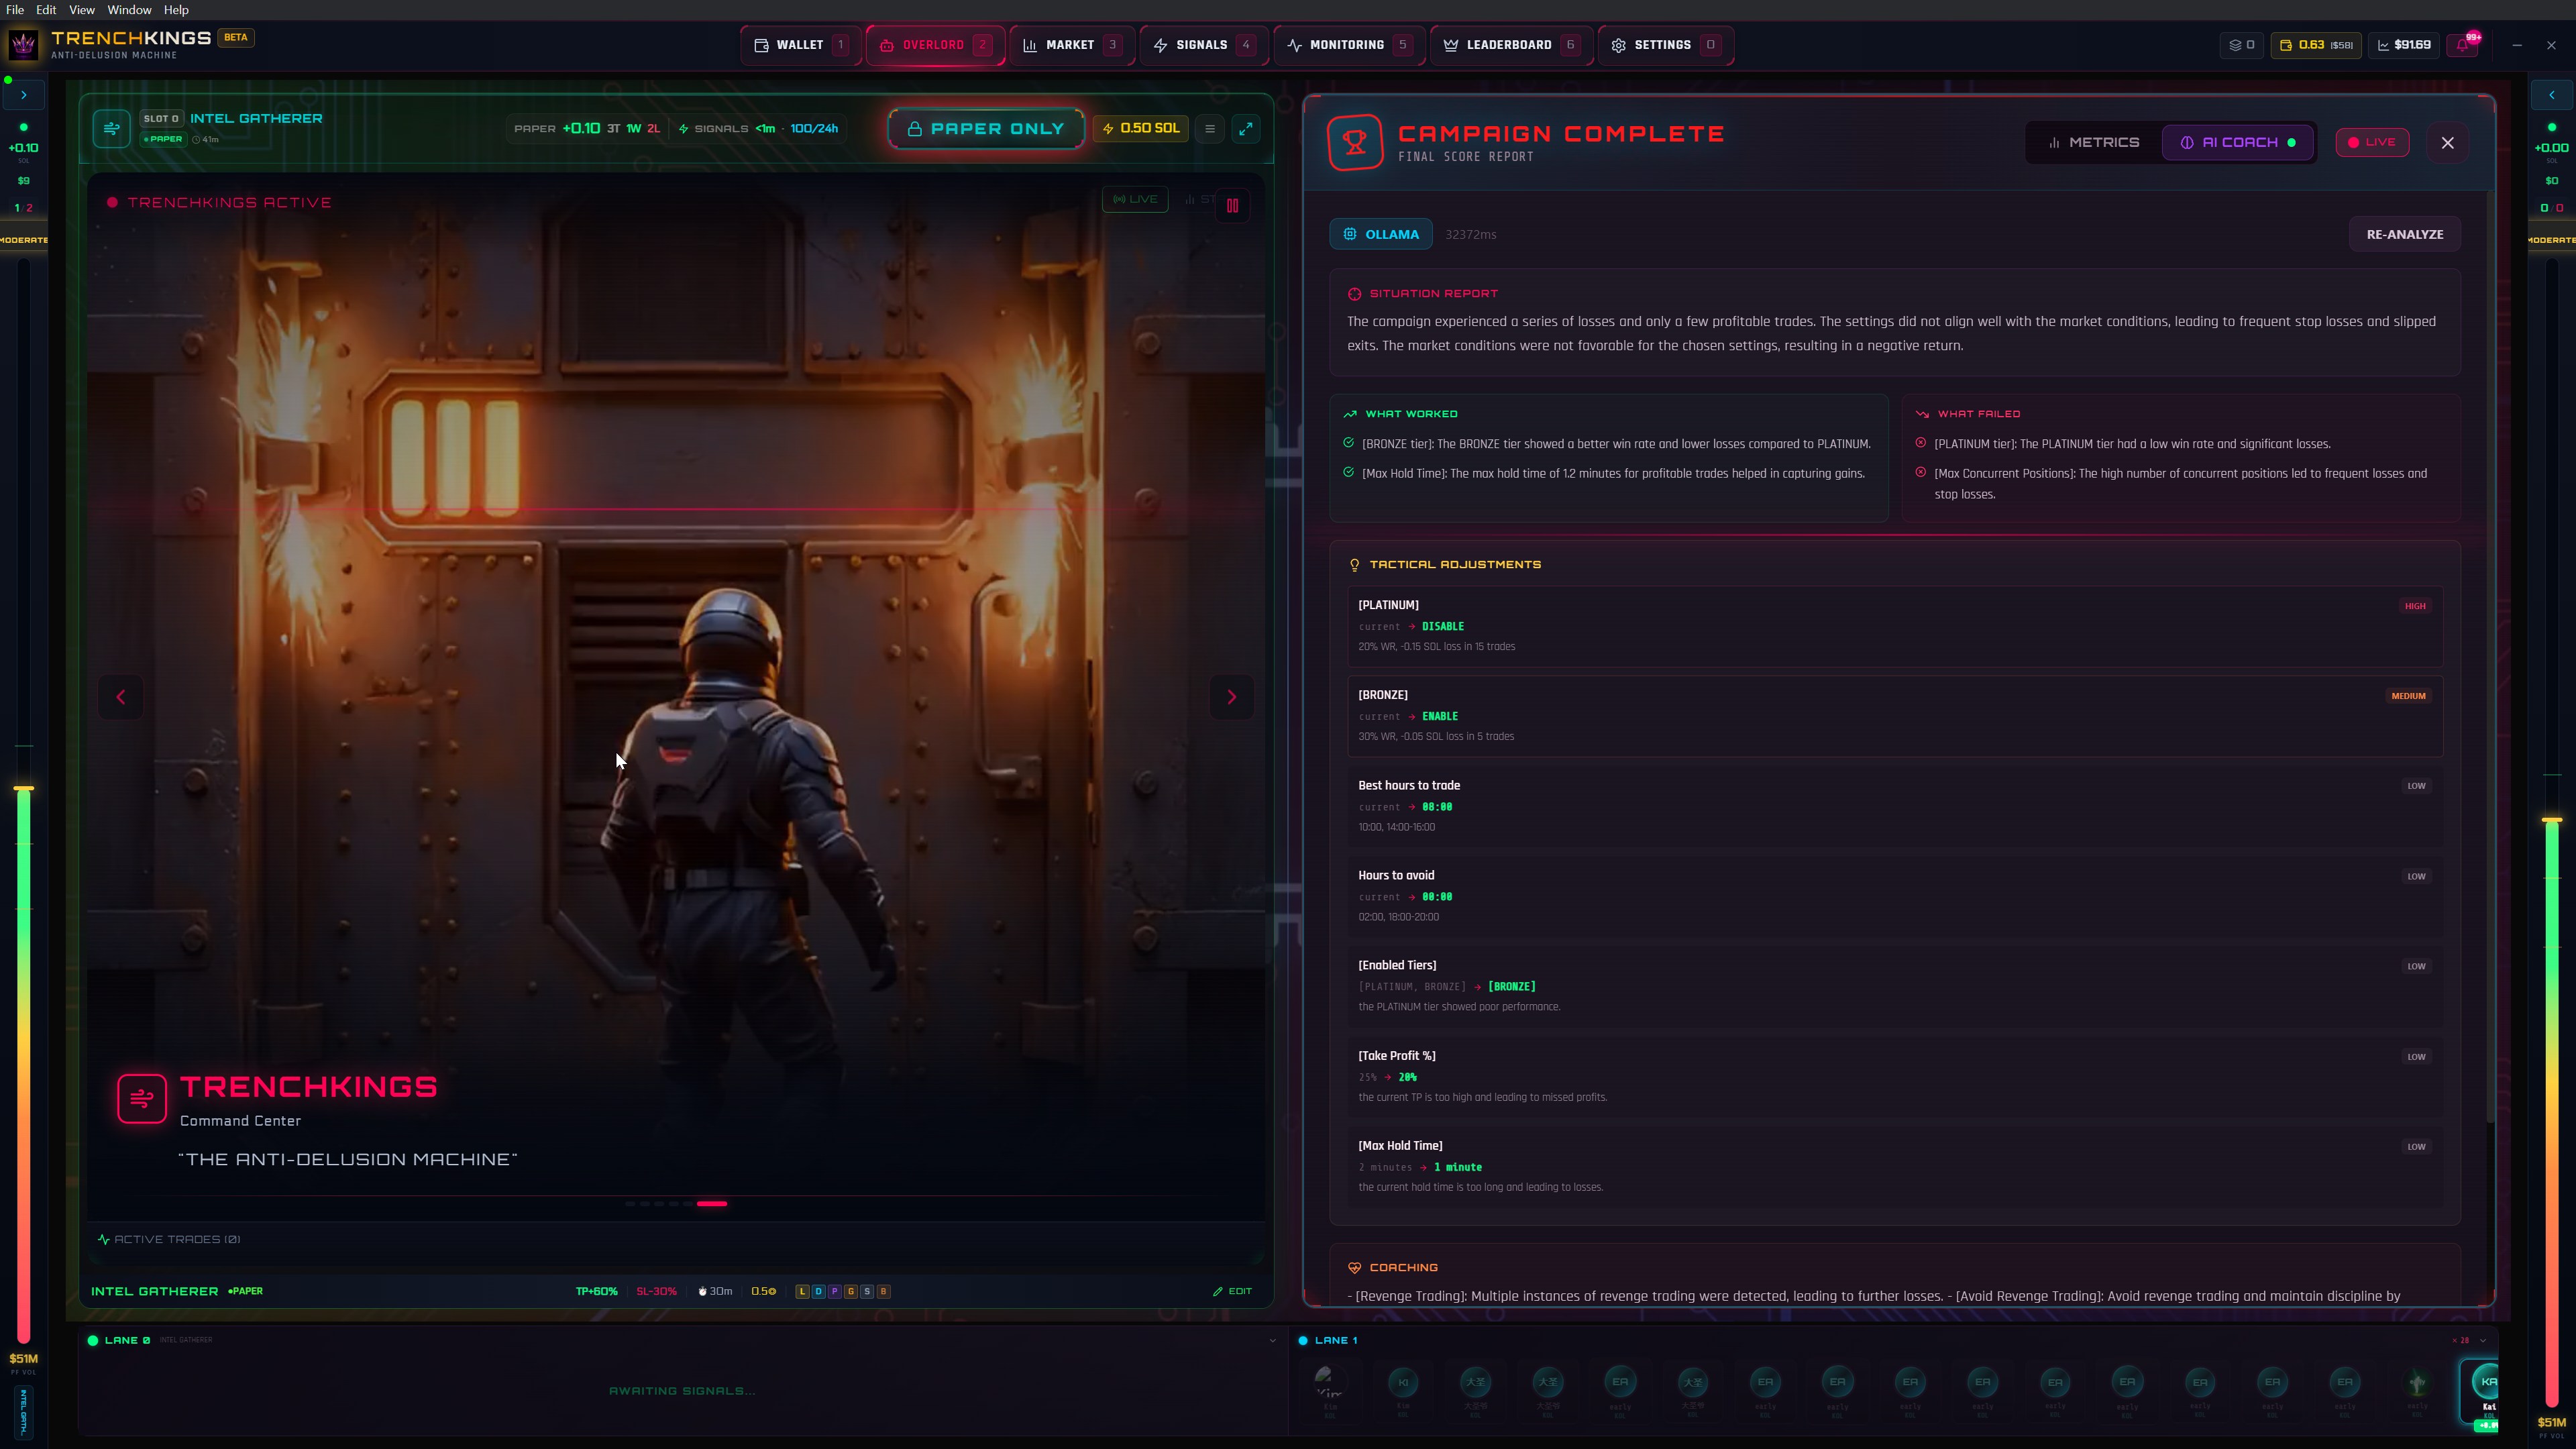
AI Campaign Report
CAMPAIGN COMPLETE with Ollama AI analysis. Situation report, tactical adjustments, and coaching. The Anti-Delusion Machine tells you what went wrong.
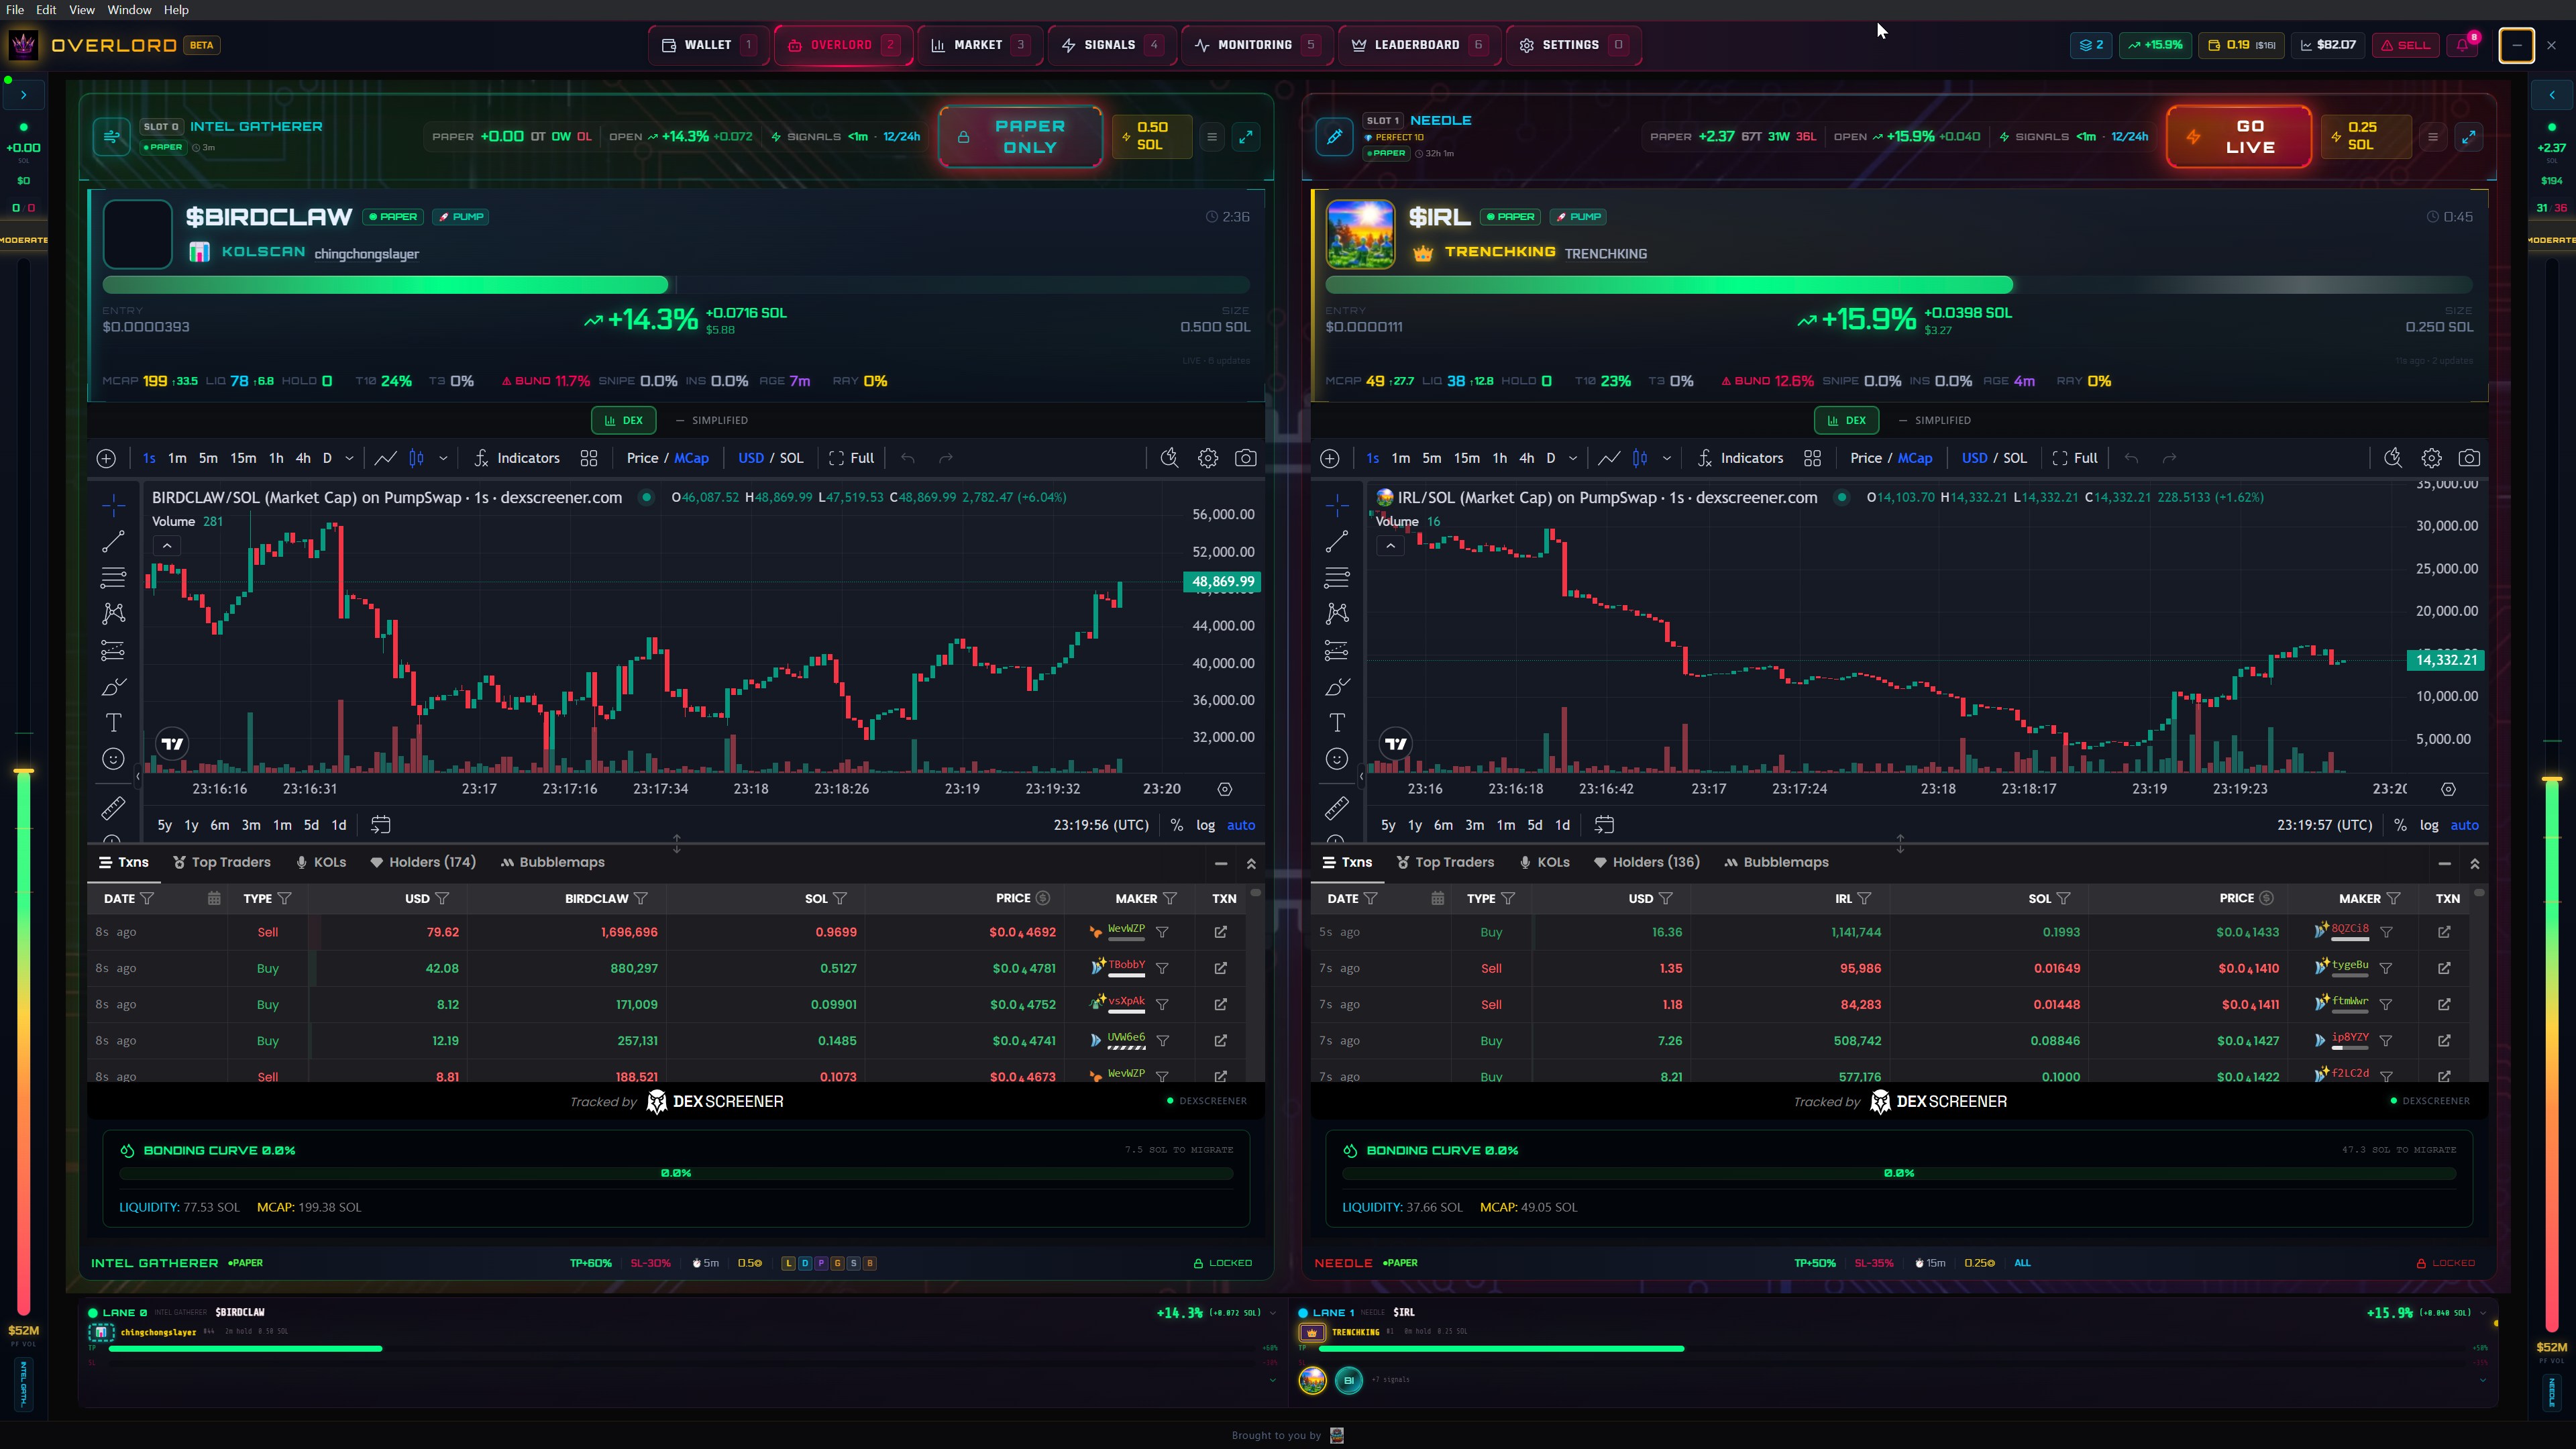
Live Copy-Trading
Dual-lane live copy-trading: KOLSCAN paper scouting $BIRDCLAW at +14.3% alongside TRENCHKING live trading $IRL at +15.9%. DexScreener charts embedded.
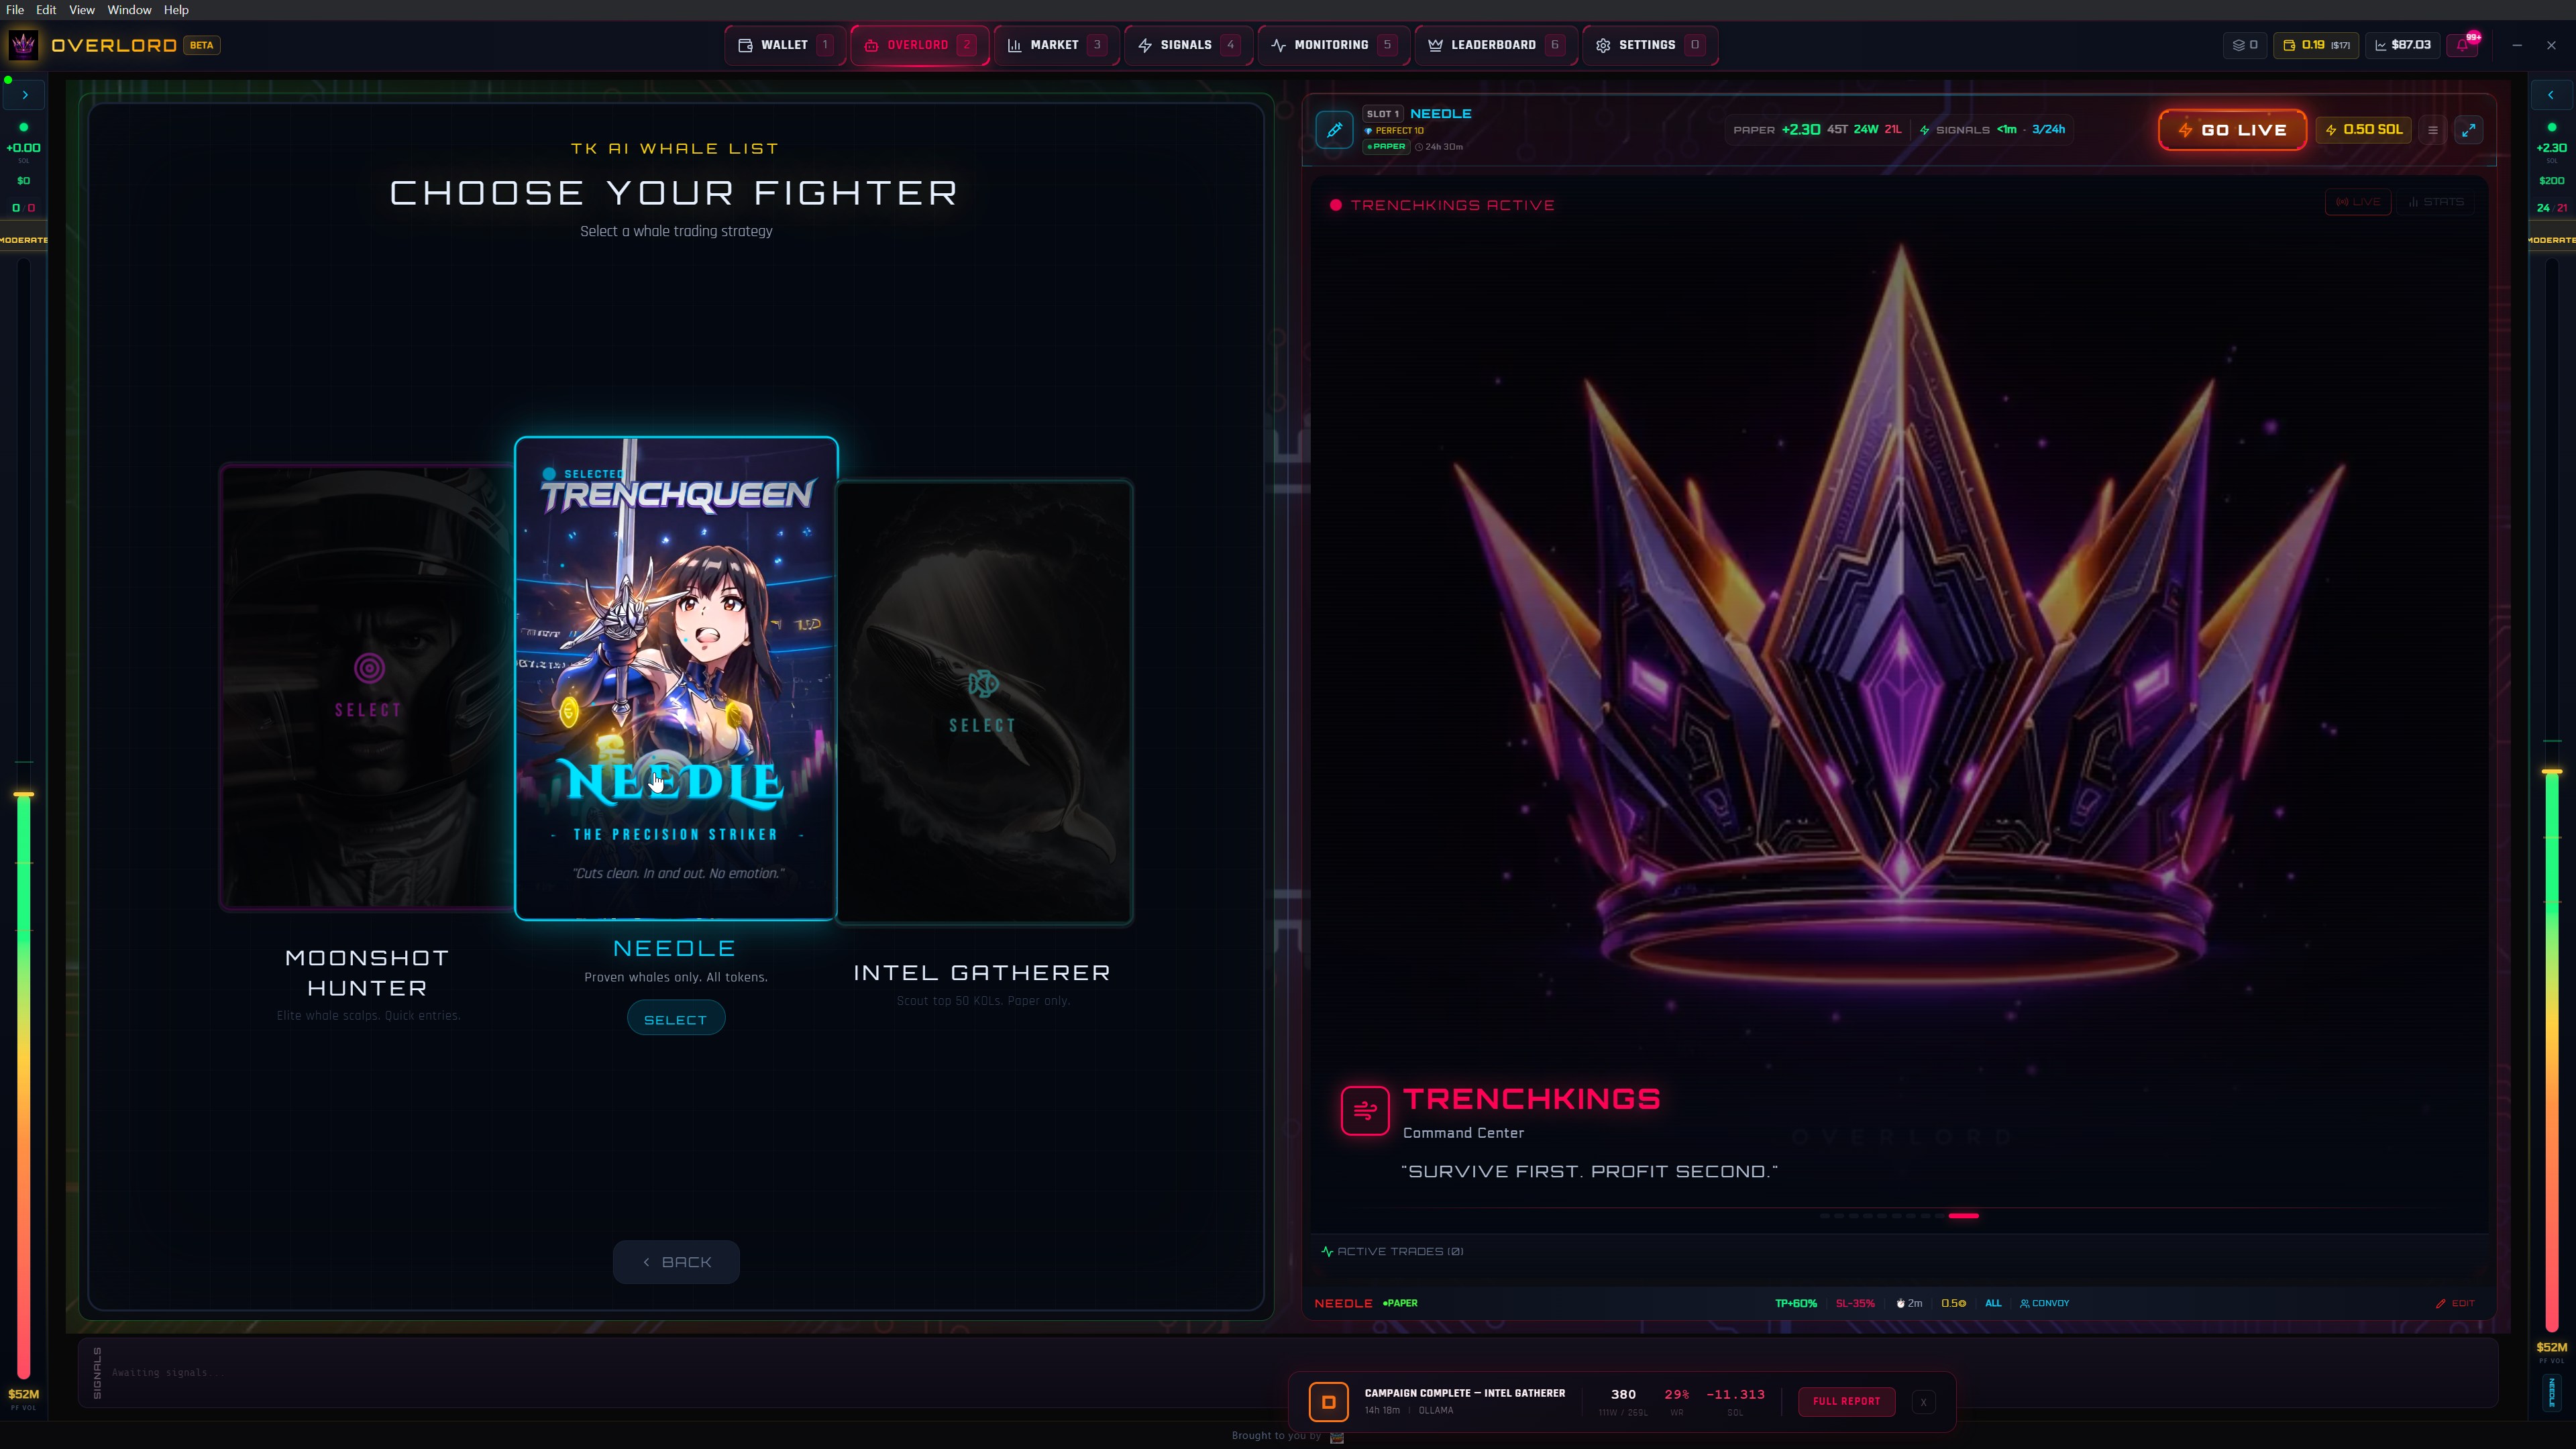
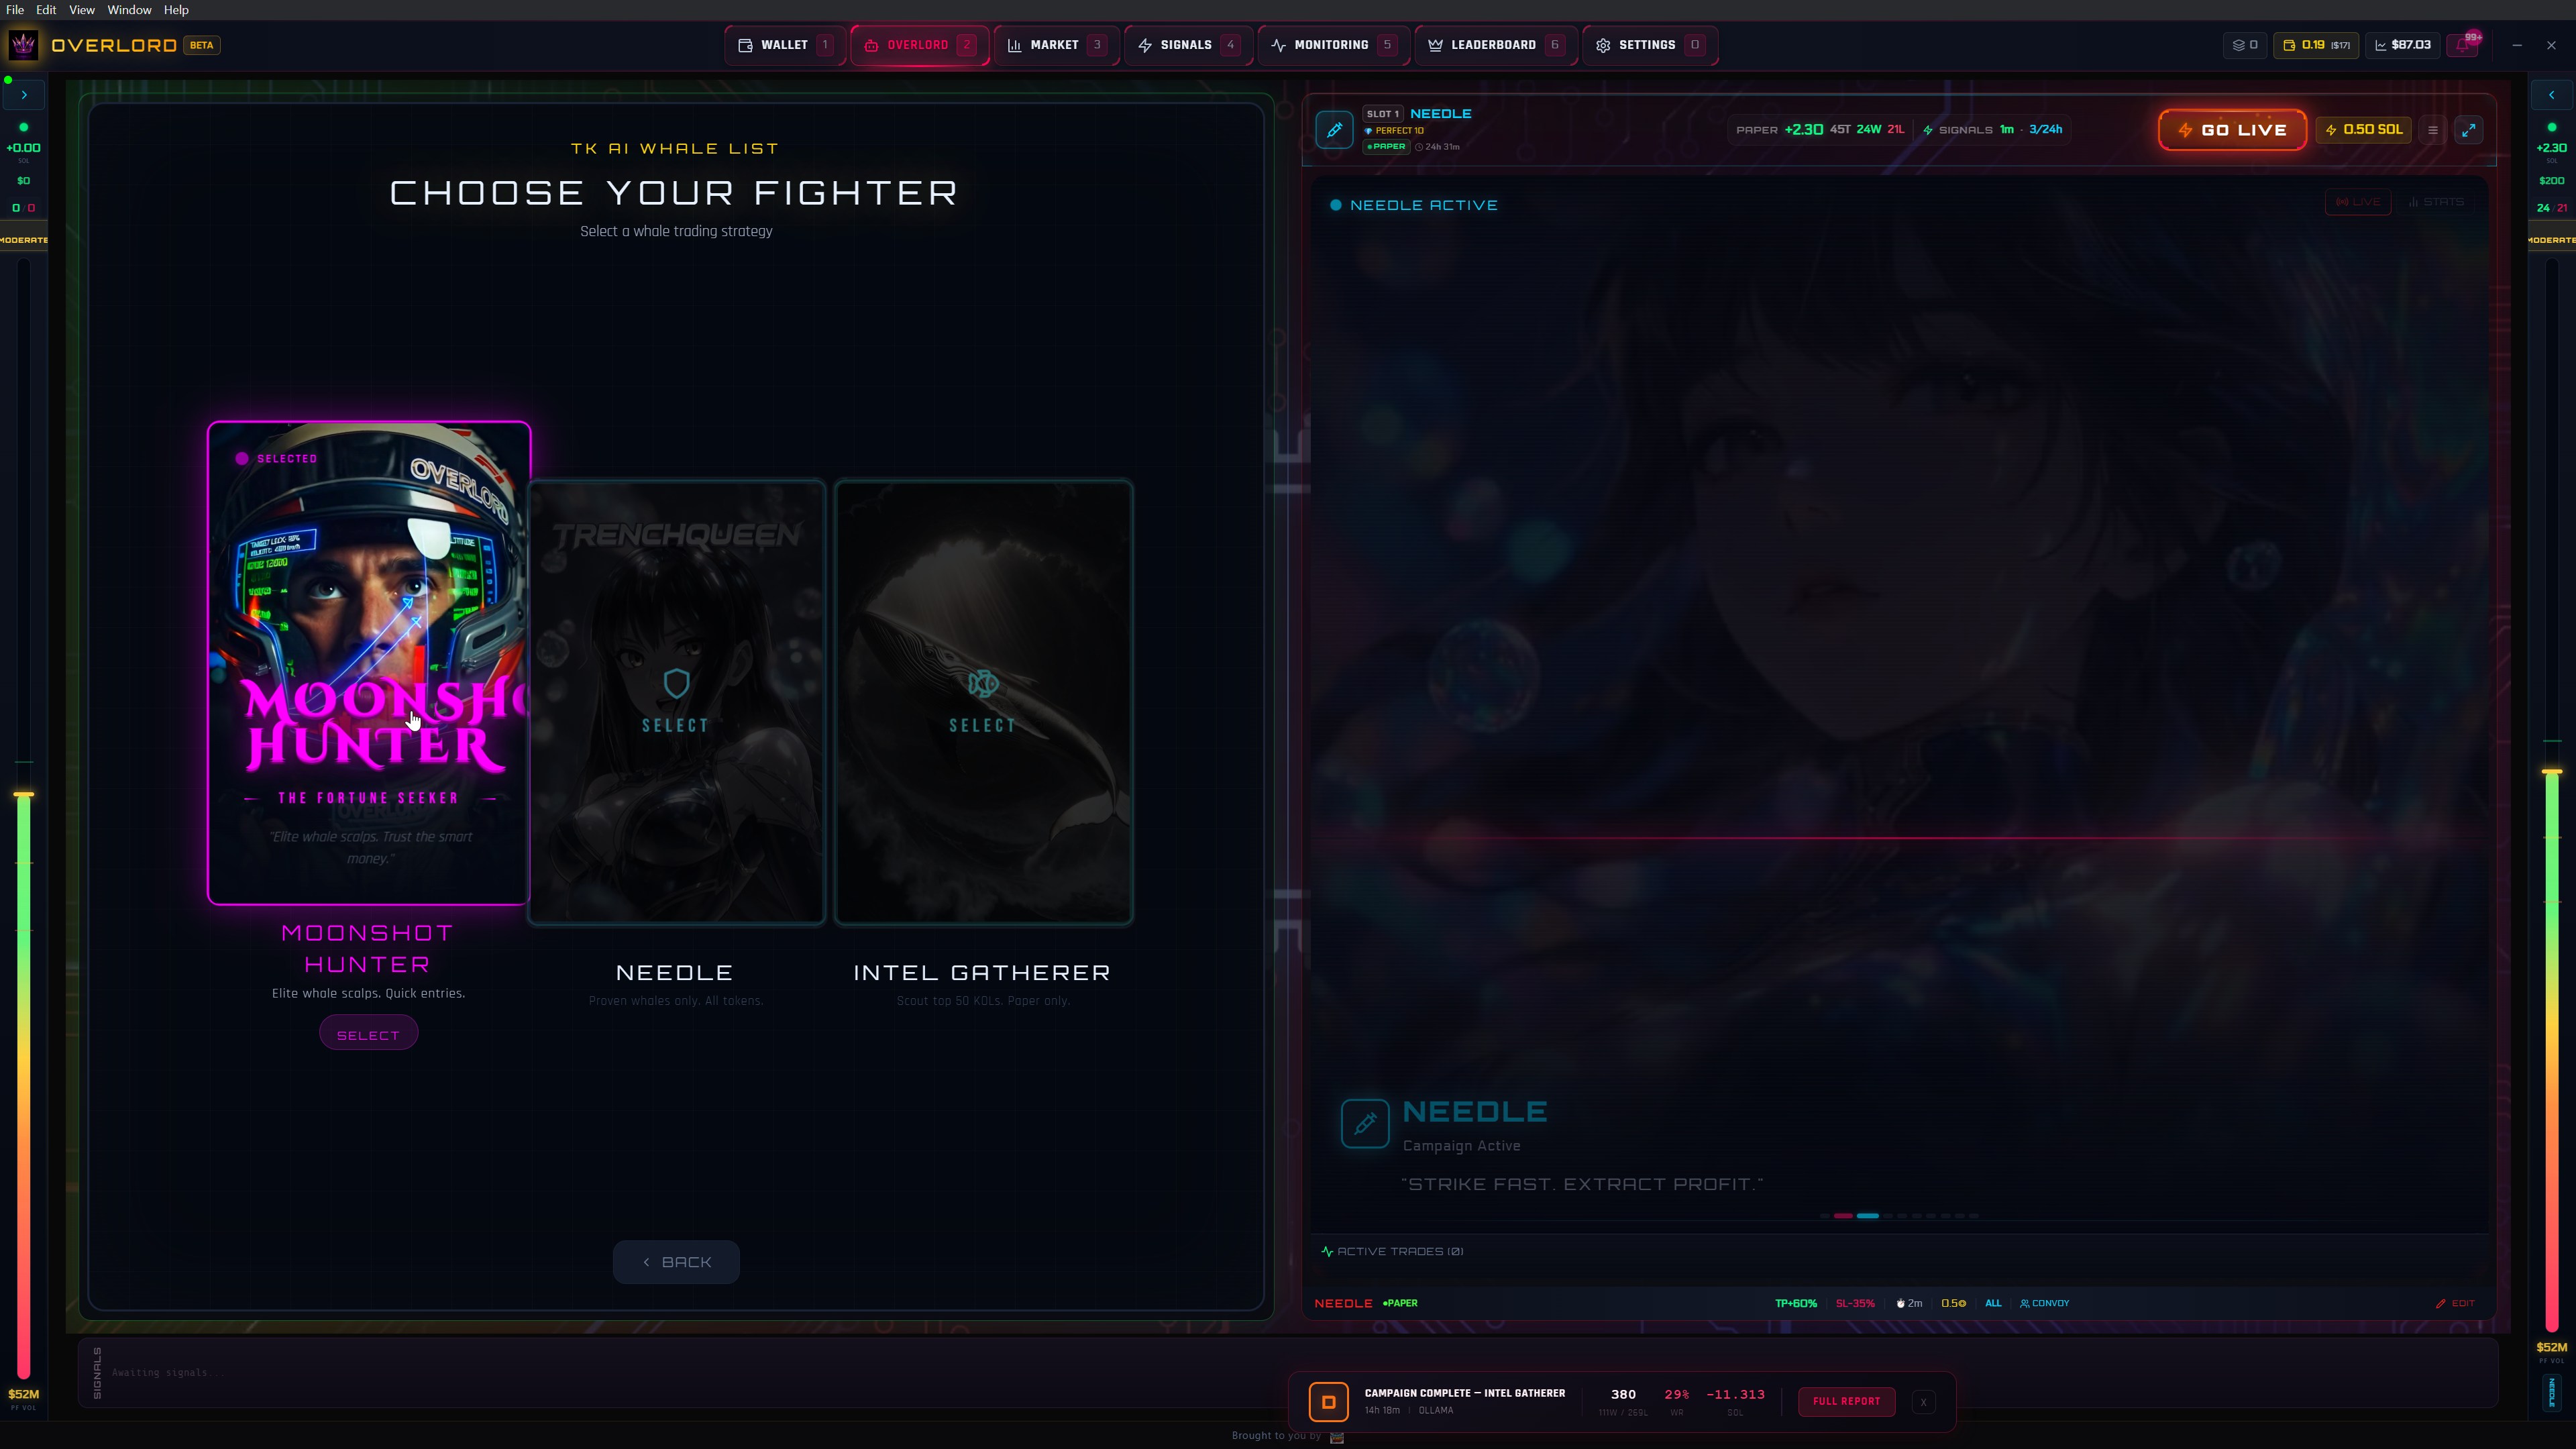
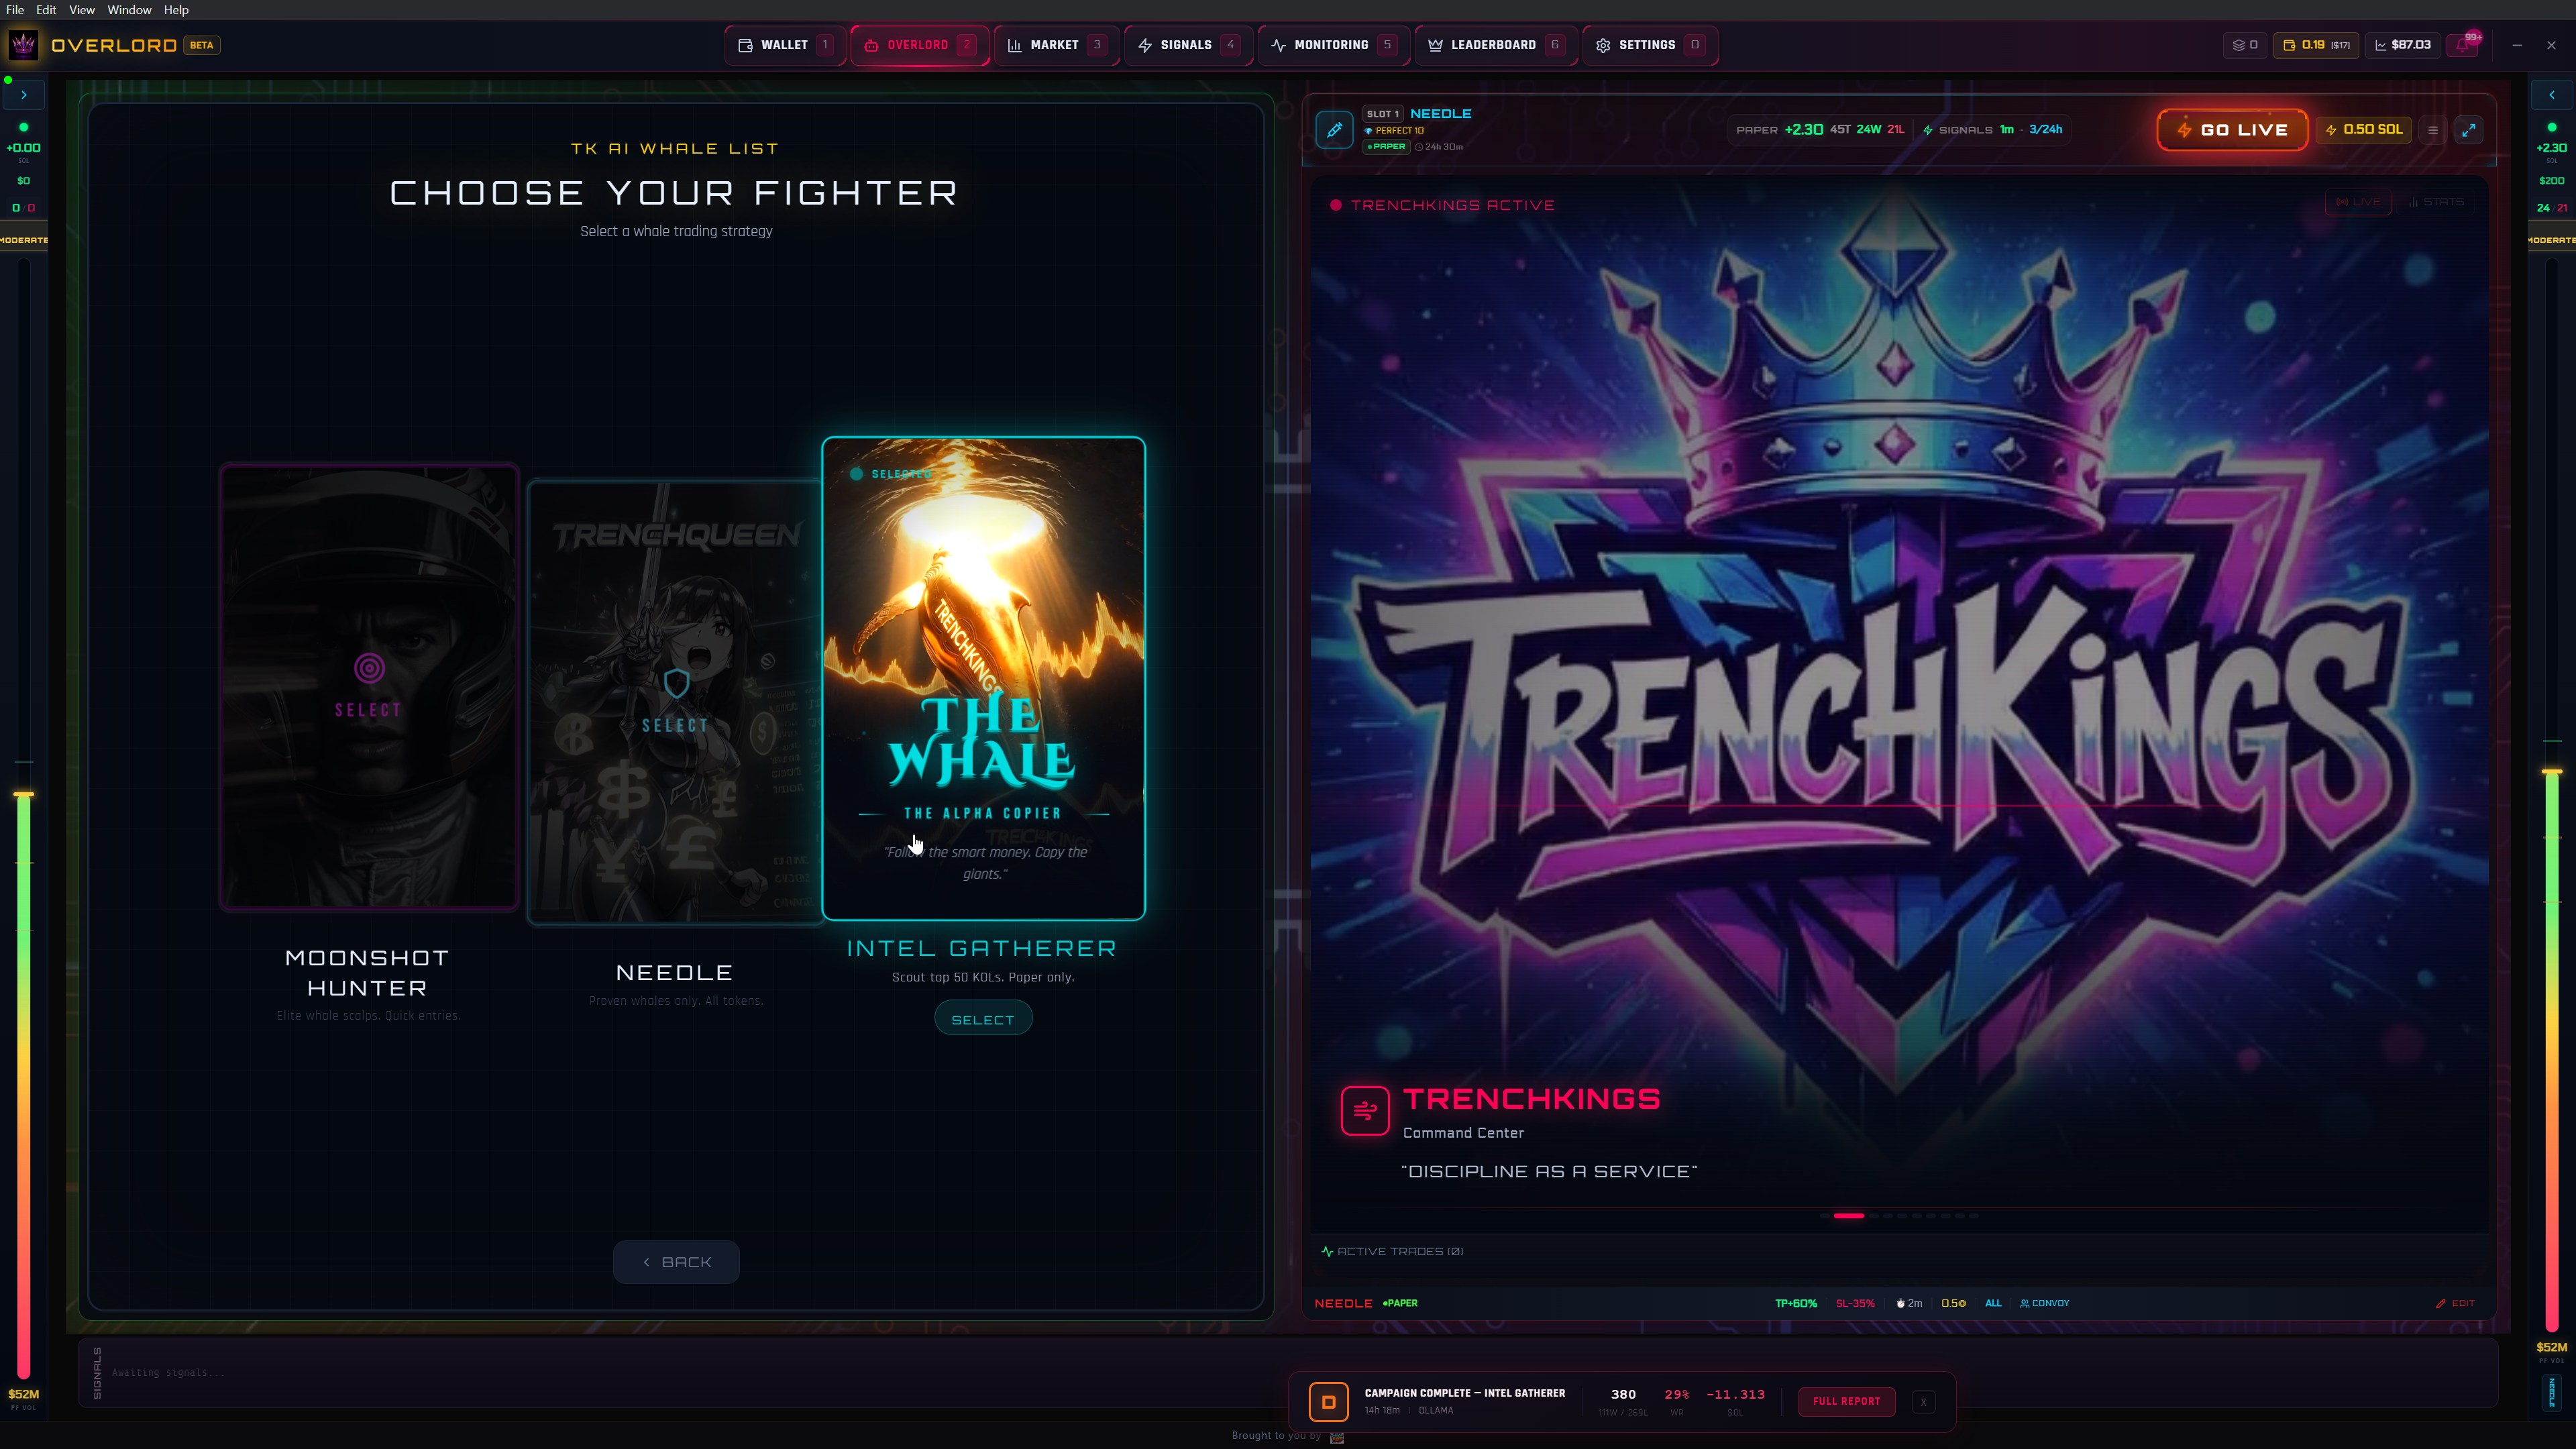
Choose Your Fighter
Archetype selection screen with TRENCHQUEEN highlighted. Each fighter has unique trading parameters, personality, and strategy. TrenchKings crown on the right lane.
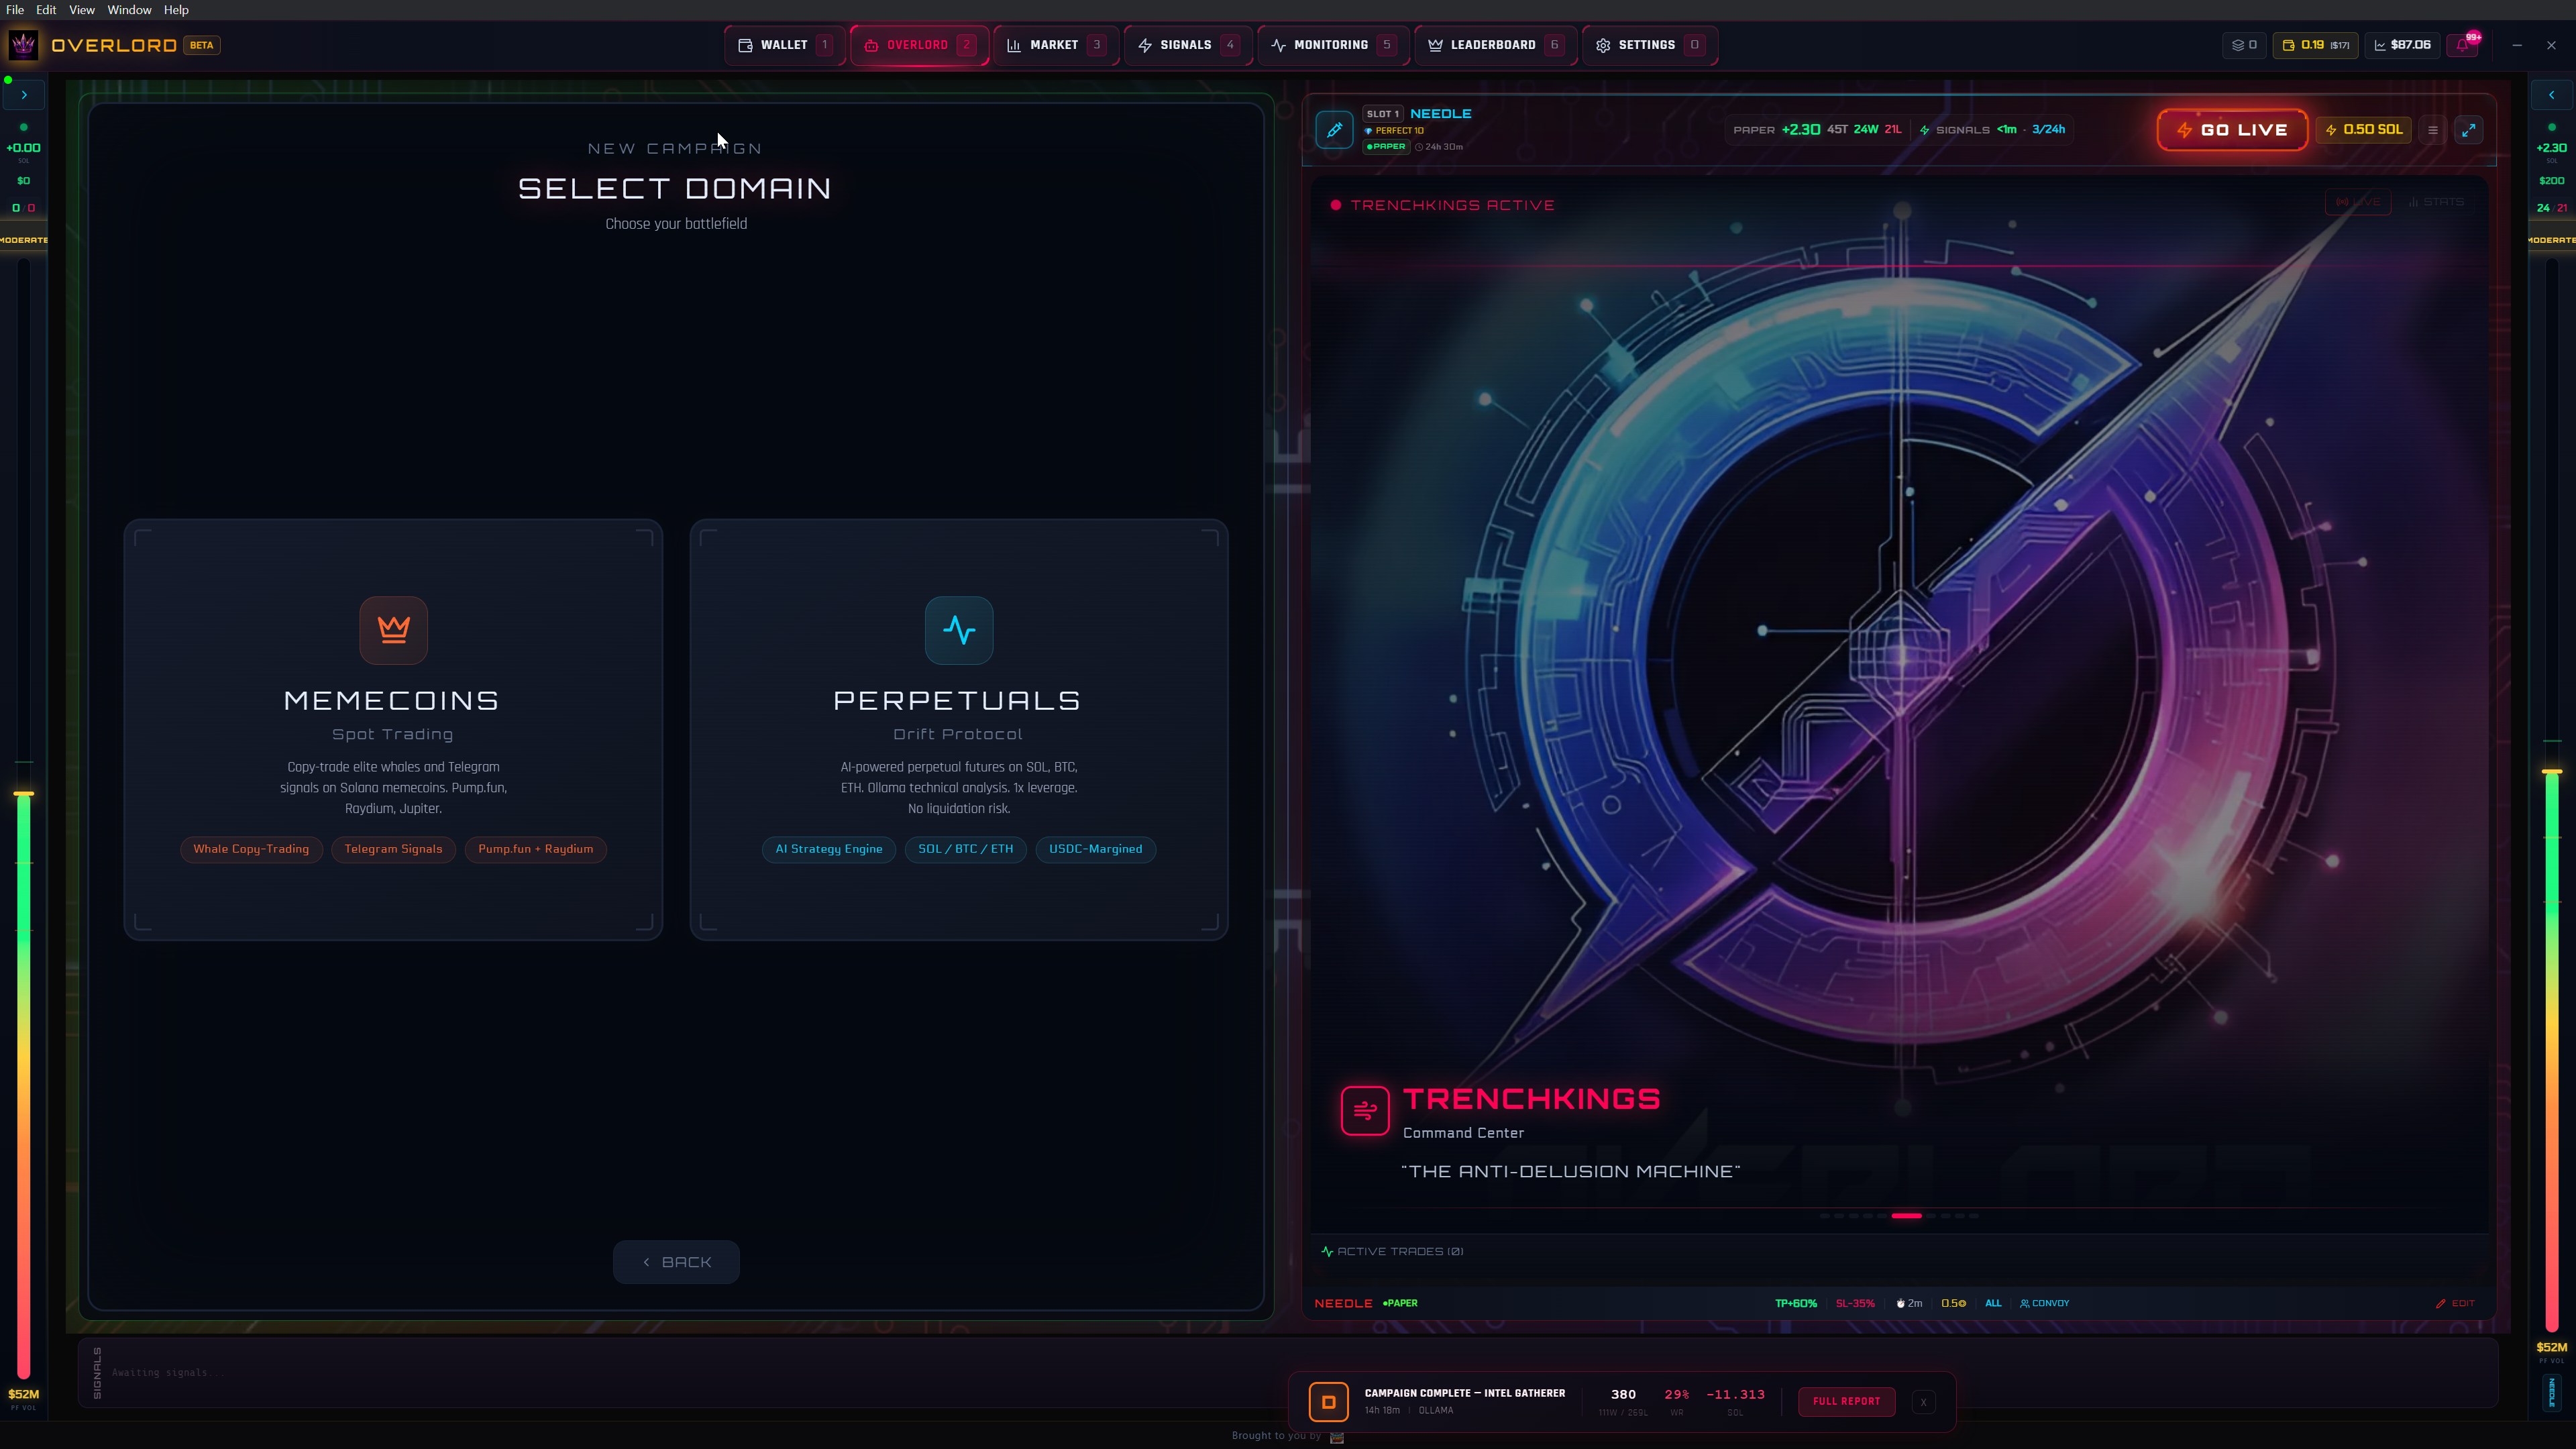
Select Domain
Choose your battlefield: Memecoins (whale copy-trading, Telegram signals, PumpFun) or Perpetuals (AI strategy engine, SOL/BTC/ETH, USDC-margined).
Whale Hunter Command
Dual-lane command: WHALE HUNTER tracking smart money on the left, TRENCHKINGS command center with the Overlord compass on the right. "Follow Smart Money."
Intelligence Report
380-trade analysis: exit breakdown, hourly P&L heatmap, token winners/losers, hold time distribution. AI Coach with tactical adjustments and regime performance.
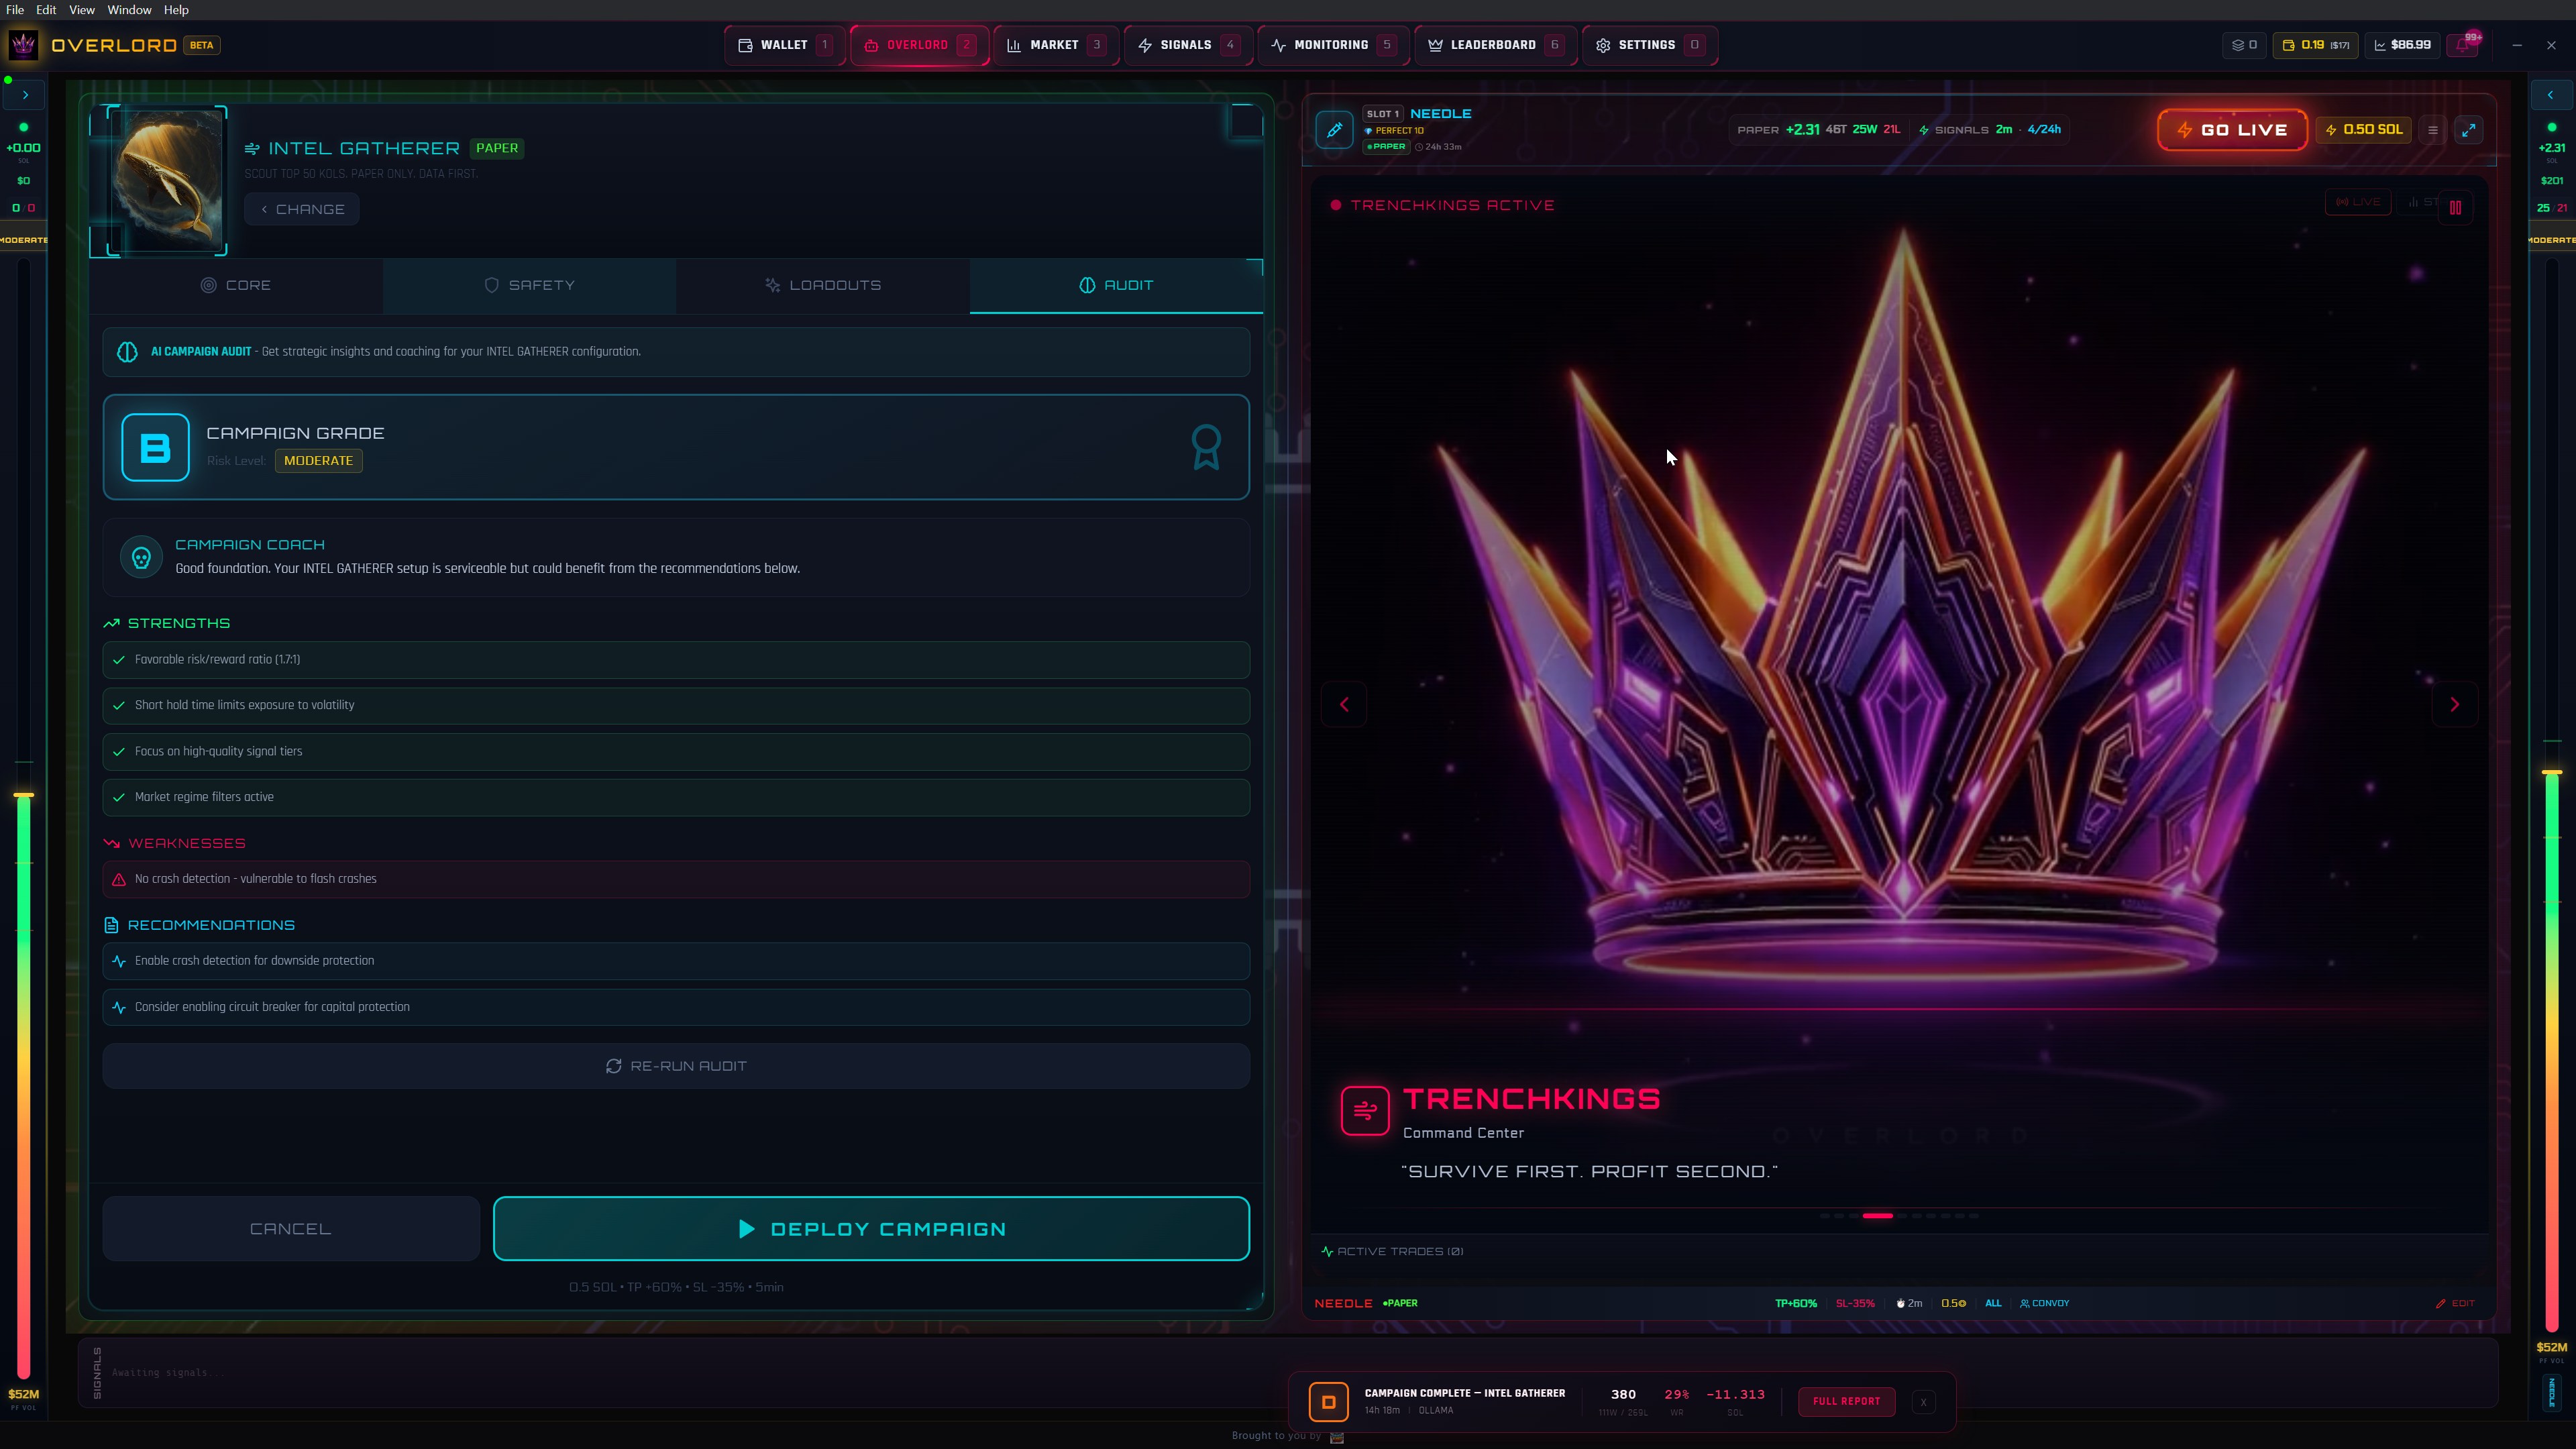
AI Campaign Audit
Campaign Grade B (MODERATE). AI-powered strengths/weaknesses analysis, crash detection recommendations, and one-click re-audit. Deploy with confidence.
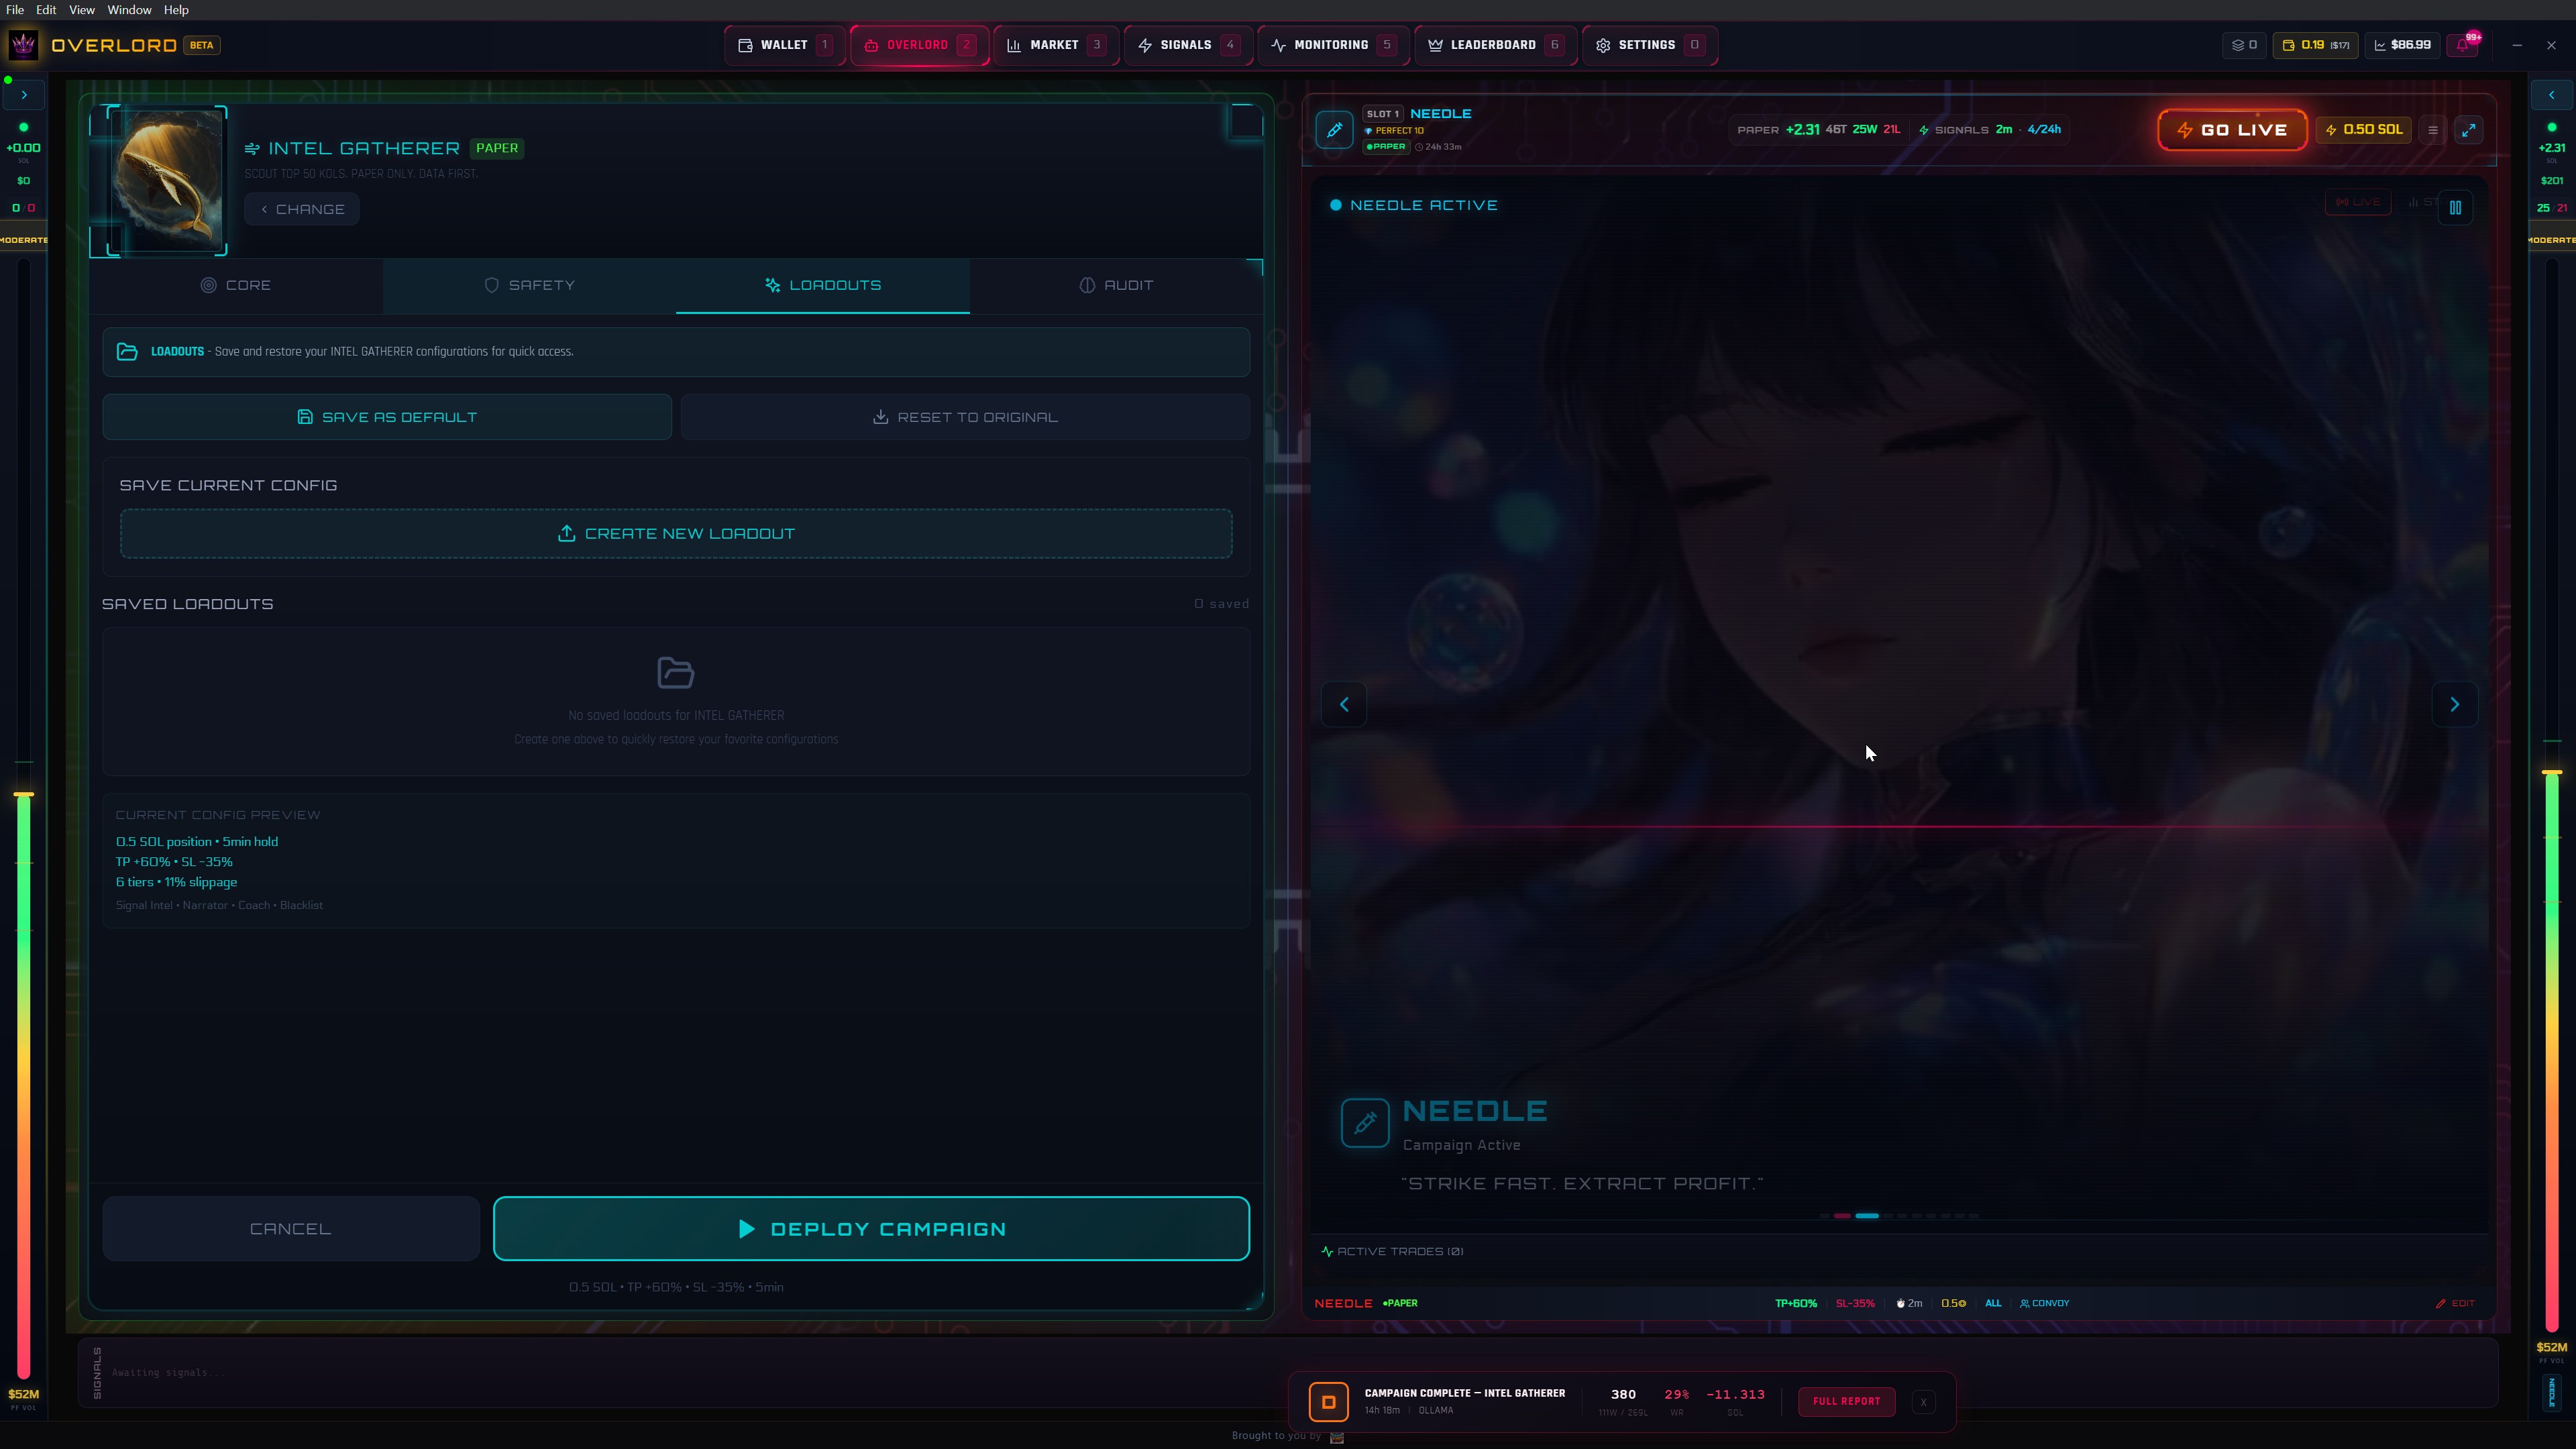
Loadouts System
Save and restore campaign configurations. Current config preview (0.5 SOL, TP +60%, SL -35%, 5min hold). NEEDLE active on the right lane. One-click deploy.
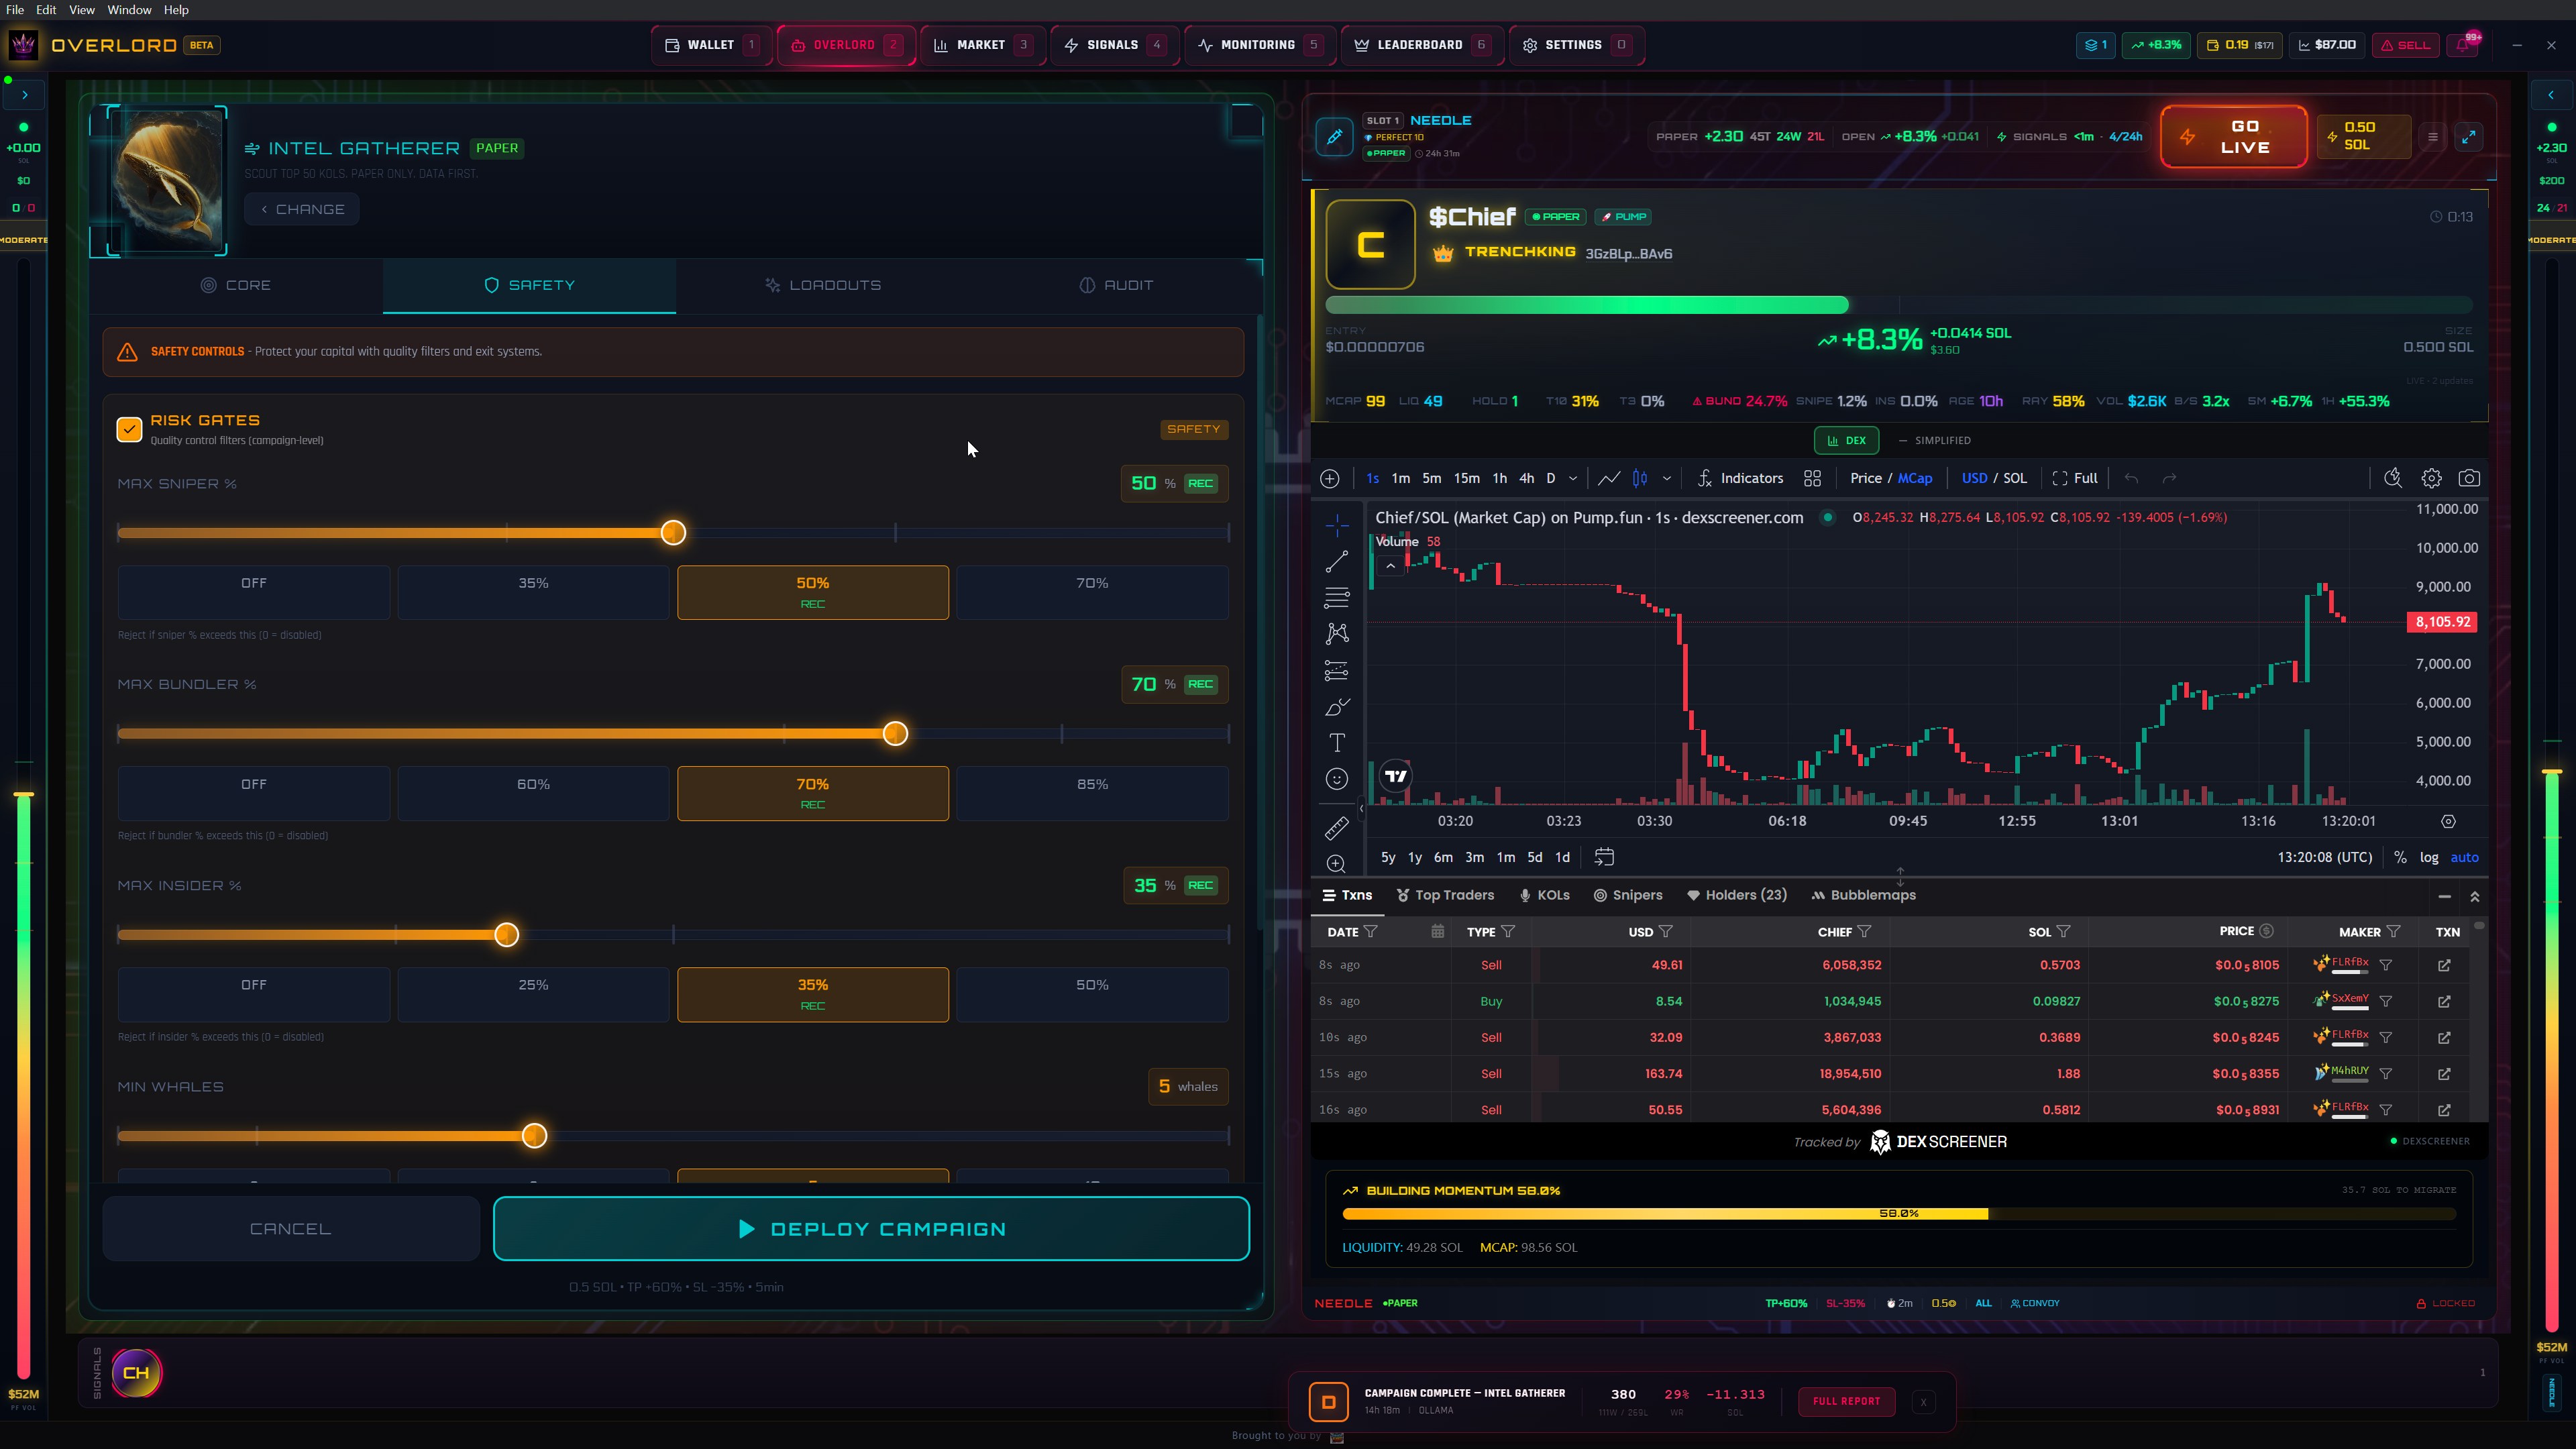
Safety Gates + Live Trade
Risk Gates (sniper/bundler/insider %) alongside a live TRENCHKING copy-trade at +8.3%. Configure safety while trading.
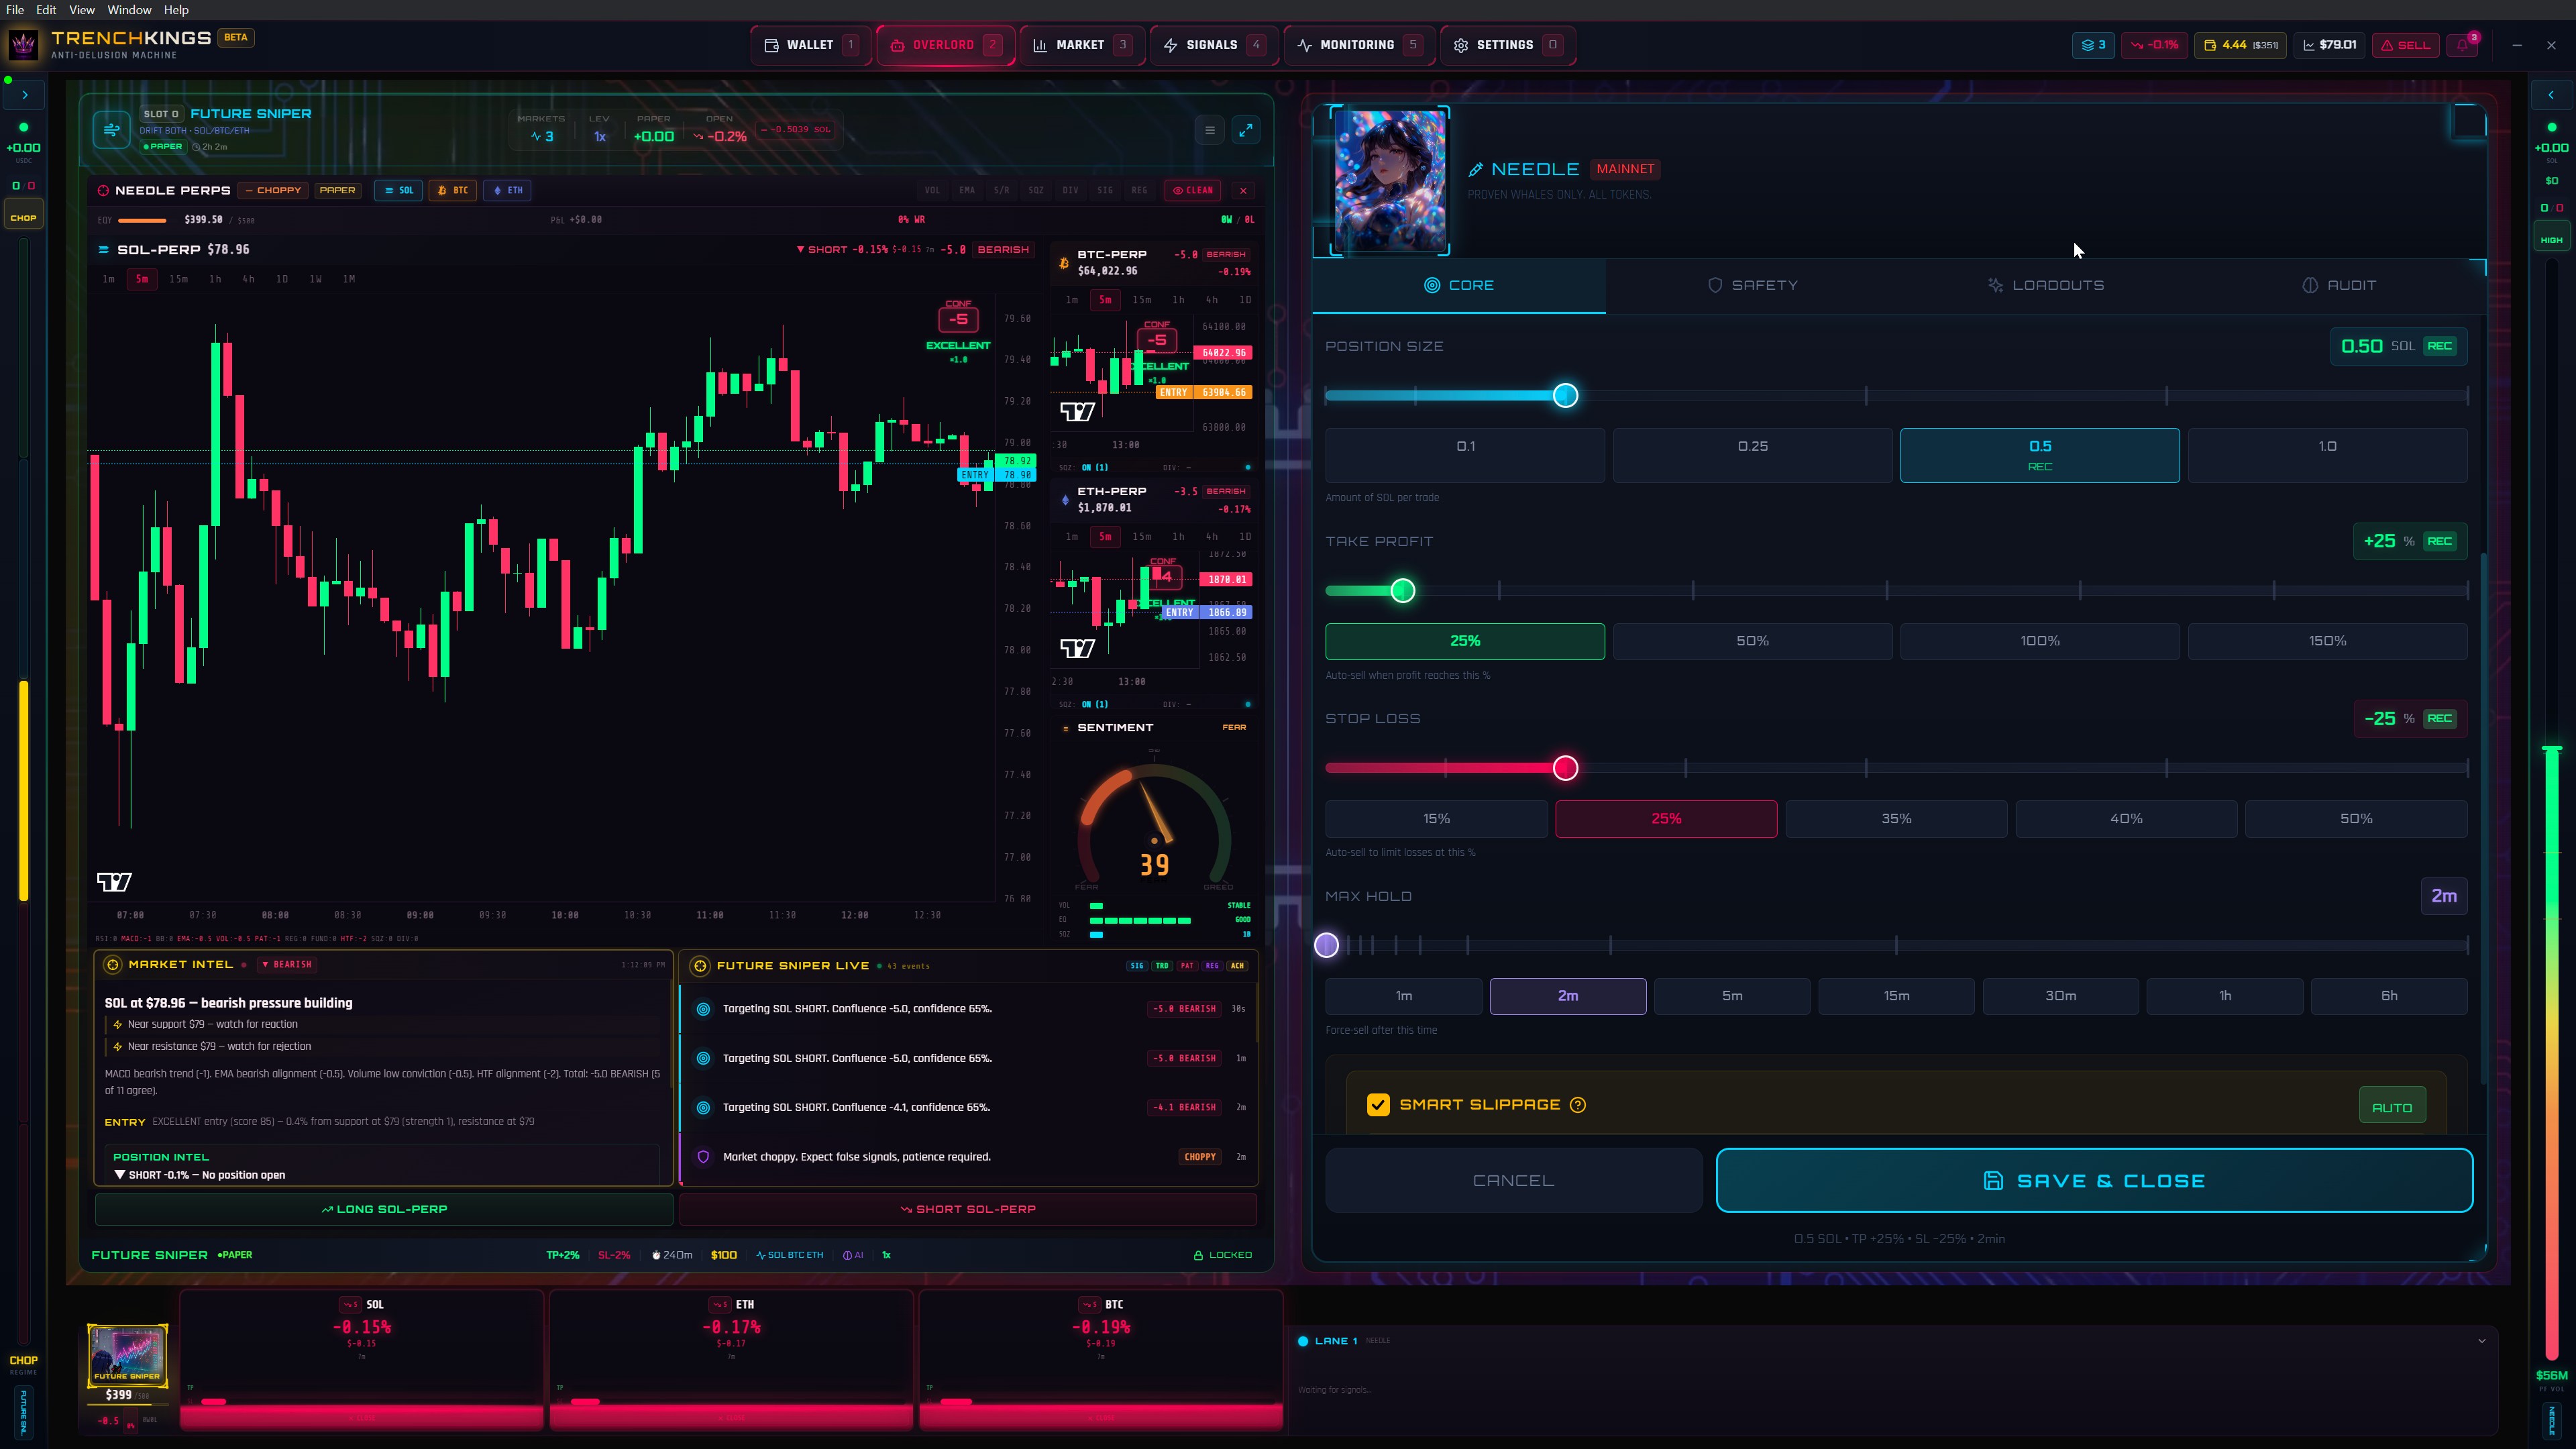
Configuration — Core
Position size, Take Profit, Stop Loss, Max Hold, Smart Slippage. Every parameter tuned per archetype.
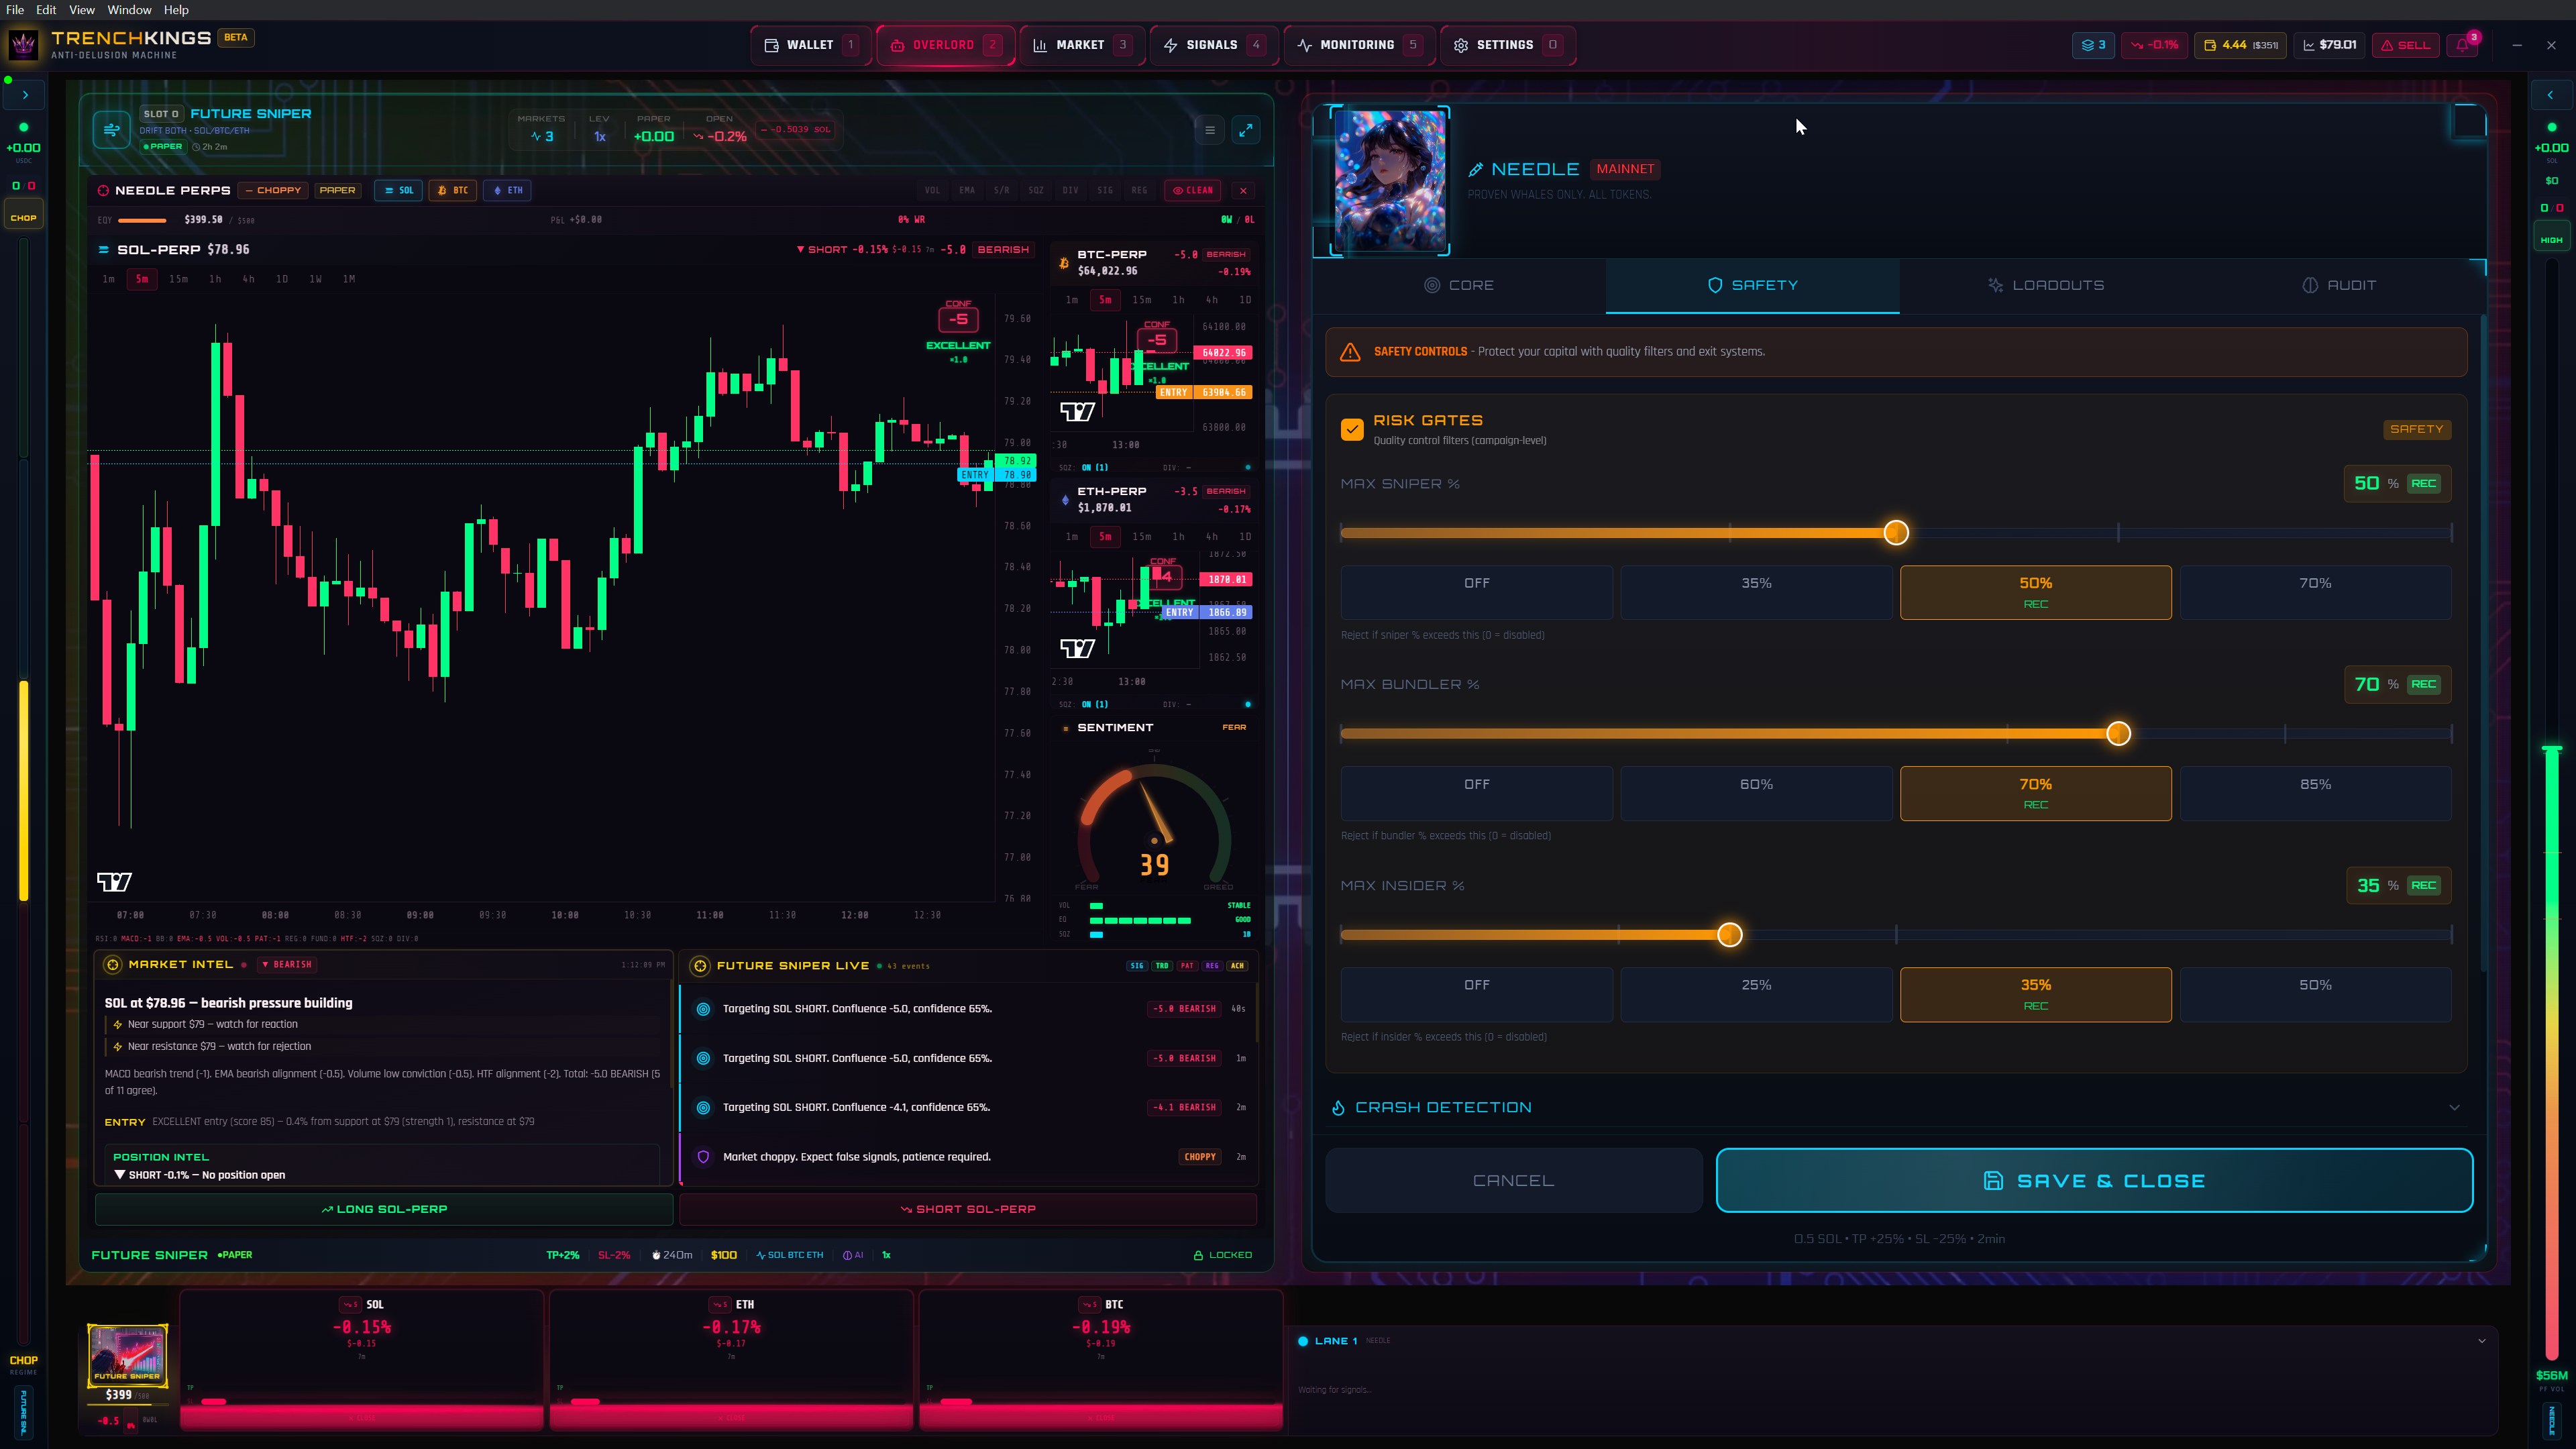
Configuration — Safety
Max Sniper %, Max Bundler %, Max Insider %, Crash Detection. The Anti-Delusion Machine enforces discipline.

Why Overlord Terminal?
TARiver AI Engine
Hybrid AI: instant rule engine fires in under a second, Ollama handles ambiguous cases. Confluence scoring across RSI, MACD, BB, EMA, Volume, Patterns, Regime, HTF, Funding.
Multi-Venue Terminal
25+ markets across Drift and Hyperliquid. Live candlesticks, TA strips, confluence bars, positions, AI signals — all from one screen.
Market Regime Detection
BTC-based 5-state regime (FLASH_CRASH to TRENDING_UP) cascades to all markets. Direction-aware exits. ATR-adaptive stop losses.
Discipline as a Service
1x leverage enforced. Non-negotiable SL/TP. Daily loss circuit breakers. Max hold duration. The AI is the discipline you can't maintain yourself.
Simple Pricing
-
$29
Officers Club
Founding members — locked in forever. Full access. -
$49
Referrals
Invited by Officers. Full terminal + AI + perps. -
$99
Public
General access when we launch. Everything included. -
1%
Platform Fee
1% on trades. Perps in beta — no fees while testing.

-

AI Perp Trading
25+ markets on Drift + Hyperliquid
-

Free Local AI
Ollama runs on your hardware — $0/month
-

Windows & Mac
Real desktop software, not a browser tab
-

100% Non-Custodial
Your keys never leave your machine
Roadmap
Memecoin Trenches
- Core terminal for Windows & Mac
- 500ms position monitoring, software SL/TP
- Paper trading engine, whale network, BULLETPROOF scoring

Perp Pivot + Multi-Venue
- Drift Protocol + Hyperliquid integration (25+ markets)
- TARiver hybrid AI engine (rule engine + Ollama)
- PerpTradingView unified multi-venue terminal
- FUTURE SNIPER (Drift) + CHAIN HOPPER (Hyperliquid) — 2,770+ fixes
- KOLSCAN pipeline, AI Campaign Audit, safety hardening
AI Trading Live
- Paper trading validation with live market data
- AI strategy tuning and campaign analytics
- Mainnet perp trading for Officers Club
Scale
- Public beta — multi-venue perp trading goes live
- iOS/Android companion apps
- Additional venues, advanced strategies
- Institutional API

Built by Engineers, Not Marketers
James
Founder & Lead Engineer20-year senior infrastructure engineer. Morgan Stanley, Lockheed Martin, 4 years at Jagex.
James
Founder & Lead EngineerLuna Seraphine
Financial OfficerFinancial Officer focused on profitability and resource management.
Luna Seraphine
Financial OfficerElias Maverick
Founder & CEOA hands on founder who loves building scaling businesses with clients.
Elias Maverick
Founder & CEOAtticus Graham
Technical SupportPassionate in seeking solutions for your problems.
Atticus Graham
Technical SupportAmara Noelle
CTO ManagerCTO Manager driving tech innovation and overseeing development strategies.
Amara Noelle
CTO ManagerEthan Mitchell
Blockchain DeveloperBlockchain Developer building secure and scalable decentralized solutions.
Ethan Mitchell
Blockchain DeveloperAurora Selene
Legal AdvisorLegal Advisor providing expert guidance on legal matters and risk management.
Aurora Selene
Legal AdvisorOrion Maxwell
Project ManagerCommitted to delivering successful projects consistently.
Orion Maxwell
Project ManagerJames
Founder & Lead Engineer20-year senior infrastructure engineer. Morgan Stanley, Lockheed Martin, 4 years at Jagex.
James
Founder & Lead EngineerLuna Seraphine
Financial OfficerFinancial Officer focused on profitability and resource management.
Luna Seraphine
Financial OfficerElias Maverick
Founder & CEOA hands on founder who loves building scaling businesses with clients.
Elias Maverick
Founder & CEOAtticus Graham
Technical SupportPassionate in seeking solutions for your problems.
Atticus Graham
Technical SupportAmara Noelle
CTO ManagerCTO Manager driving tech innovation and overseeing development strategies.
Amara Noelle
CTO ManagerEthan Mitchell
Blockchain DeveloperBlockchain Developer building secure and scalable decentralized solutions.
Ethan Mitchell
Blockchain DeveloperAurora Selene
Legal AdvisorLegal Advisor providing expert guidance on legal matters and risk management.
Aurora Selene
Legal AdvisorOrion Maxwell
Project ManagerCommitted to delivering successful projects consistently.
Orion Maxwell
Project Manager
Documentation

Security First
Overlord Terminal is built with security as a core principle. 100% non-custodial architecture means your keys never leave your machine. All trading happens locally on your hardware.
Explore Documentation
Full documentation to help you understand the terminal and get the most out of it.
-
Getting Started Guide
-
Privacy Policy
-
Terms of Service
-
Risk Disclosure
Latest Updates
-
 24, Dec 2025
-
 24, Nov 2025
139 W, 46th Street, Dubai.
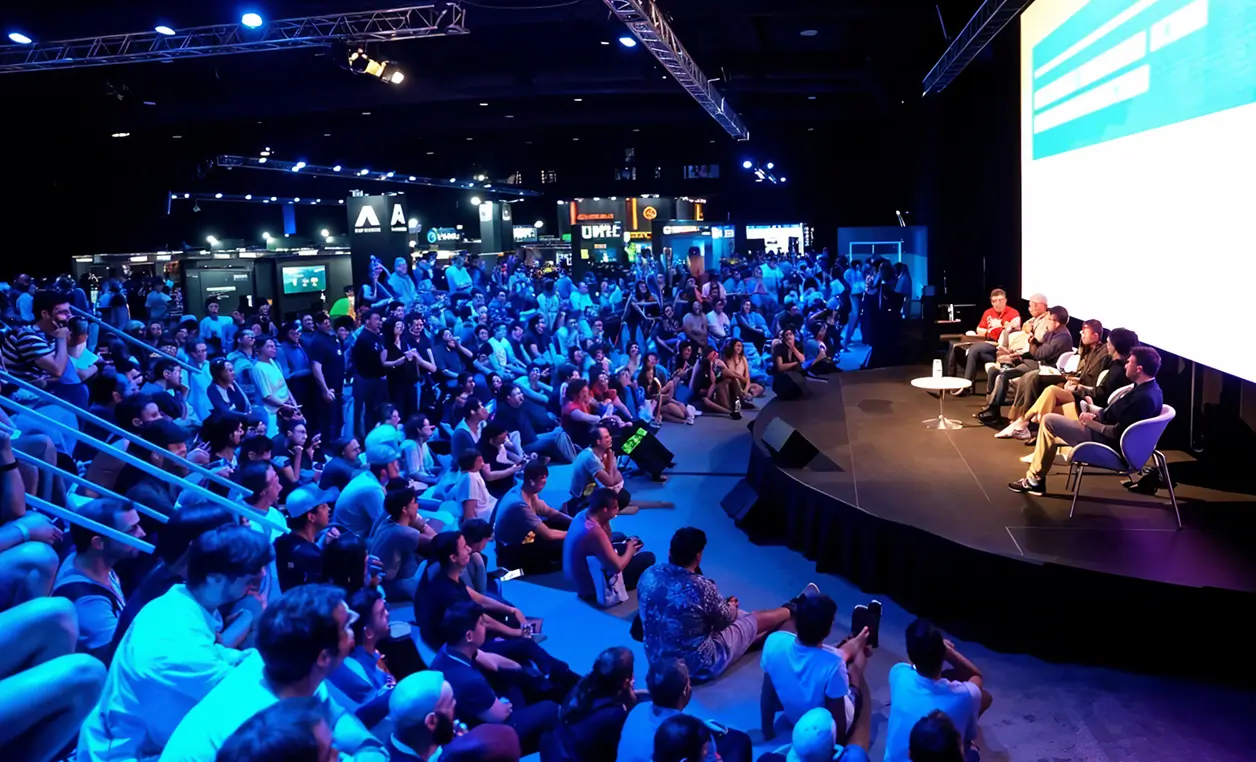
24, Nov 2025
139 W, 46th Street, Dubai.Digital Assets Forum Navigating the Crypto Landscape.
-
 24, Nov 2025
New York, NY 10036, USA.
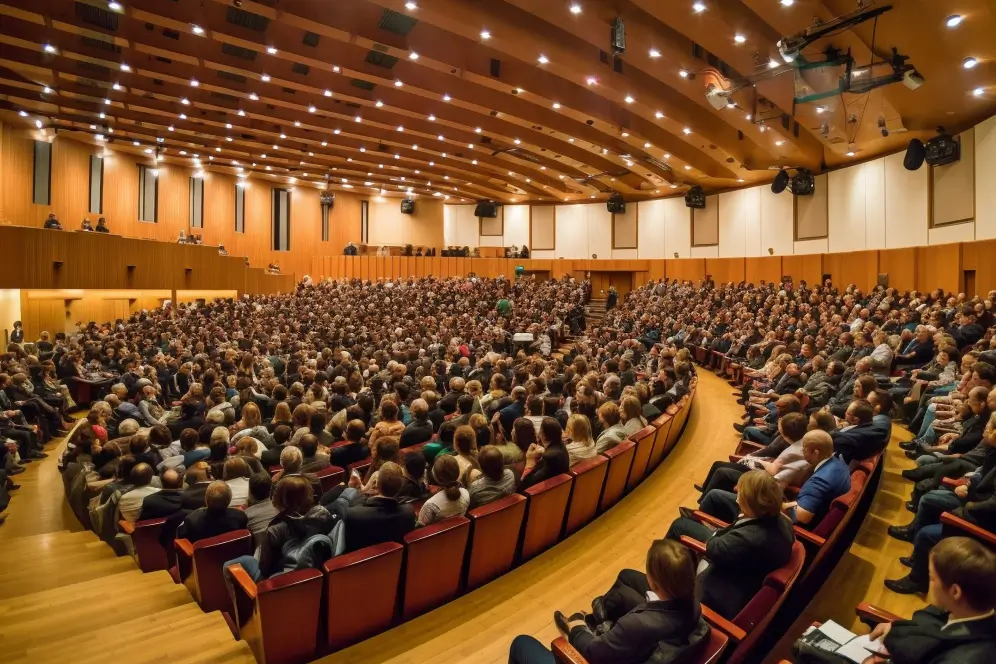
24, Nov 2025
New York, NY 10036, USA.TrenchKings Update: New Signal Quality Improvements
-
 24, Nov 2025
139 W, 46th Street, Australia.
24, Nov 2025
139 W, 46th Street, Australia.Mining Matters Maximizing Returns in Crypto Mining.
FAQ
Overlord Terminal is a professional-grade desktop crypto trading terminal. Trade 25+ perpetual futures markets across Drift Protocol and Hyperliquid, powered by a local AI strategy engine (Ollama). 1x leverage only, USDC-margined, 100% non-custodial.
- 100% non-custodial — your keys never leave your machine. Drift Protocol + Hyperliquid.
- TARiver hybrid AI: instant rule engine + Ollama for ambiguous cases. 500ms position monitoring.